Float candy on a sea of salt
With some very salty water, you can make candy bars rise up from the bottom of a glass
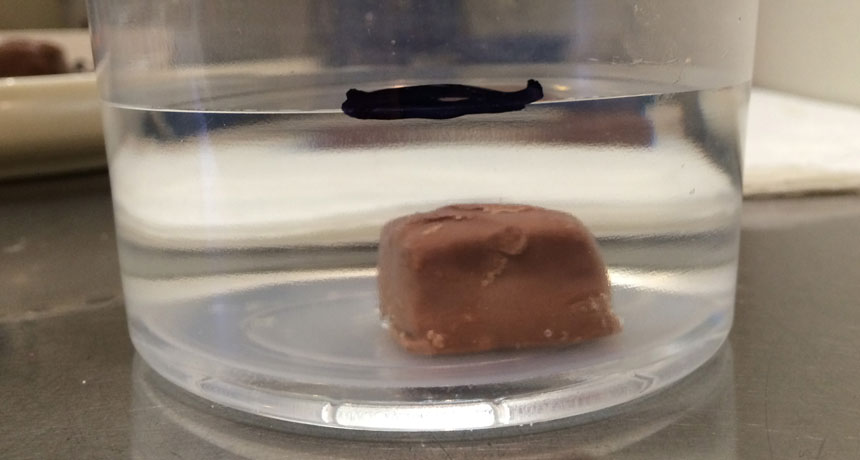
Want to make this candy bar float? All you need is a little salt and a little science.
B. Brookshire/SSP
This article is one of a series of Experiments meant to teach students about how science is done, from generating a hypothesis to designing an experiment to analyzing the results with statistics. You can repeat the steps here and compare your results — or use this as inspiration to design your own experiment.
Have you ever floated an egg or a candy bar? This popular demonstration is a fun way to learn about density — or how weighty something is for its volume. Take an egg or a mini candy bar (such as a Snickers) and plop it into a glass of tap water. The objects should sink. Now, stir in some salt. And then some more. Keep going. In time, the object will begin to float.
With enough salt, the density of the water rises until it is greater than that of the object placed in it. The less dense object will now float in the denser liquid.
But this is not really an experiment — until you test some hypothesis. A hypothesis is a proposed explanation for some phenomenon. For example, you might hypothesize that a cup of salt in a half-liter of water will float an egg, while less will not. Suddenly, you have a testable statement.
In my case, I’m going to compare two types of popular Halloween candy bars: Milky Way and Snickers. Mine are minis and similar in size. Milky Ways have nougat and caramel under their chocolate coating. Snickers have both of those and peanuts as well. I think this means Snickers will weigh more for their size. If they do, then they would be denser than the Milky Way bars. And when I go to float both types of candy, this means the denser bars should require more salt to float.
I now have my hypothesis: Snickers bars are denser than Milky Way bars, and therefore will require more salt to float.
To test this, I will need:
- a large bag of mixed mini candy bars containing Snickers and Milky Ways.
- clear plastic cups
- salt
- spoons
- a kitchen scale
- a measuring tape or ruler
- paper towels (To clean up the mess!)
- and water
What are you, dense?
First, I must confirm that my Snickers are actually denser than my Milky Ways. Density is the mass (weight) of an object divided by its volume. I gathered 26 bars of each candy, and weighed them one by one on my scale.
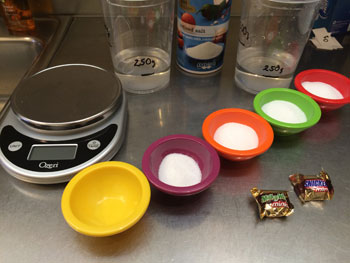
I carefully measured the length, width and height of each piece of candy. By multiplying these numbers together, I obtained the volume of each bar.
Now that I had the mass and the volume, all I had to do was divide the mass by the volume to get each candy bar’s density.
Then I performed statistical analyses — mathematical processes — on those numbers to find out if the mass, volume and density of the Snickers differed from those of the Milky Way bars. For each measurement, I calculated the mean for each kind of candy — a measure of the average. Then, I used more math to calculate how much each group of numbers spread over and under that mean.
Once I knew the data spread, I was able to run a statistical test (called a Student’s t test). This can determine if two sets of measurements are different enough from one another to be important. You can run this test yourself with many free online calculators, or in Microsoft Excel.
The test produces a p value. This number represents how likely I am to see a difference between two groups as large or larger than the difference I measured (if there had been no real difference between them). If there is less than a 5 percent chance — represented as a p value of less than 0.05 — that the difference I saw was merely accidental, scientists tend to report this value as being statistically significant.


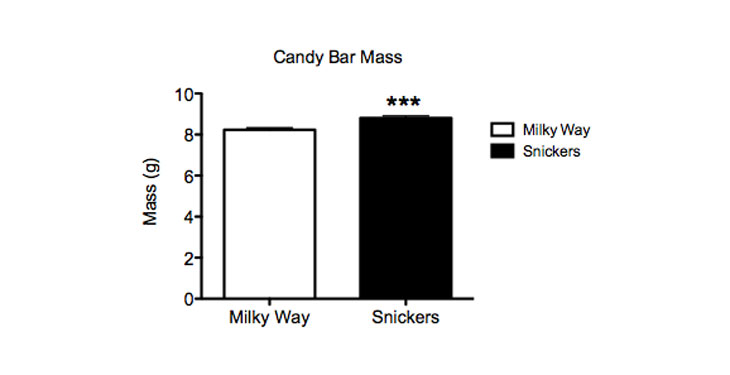
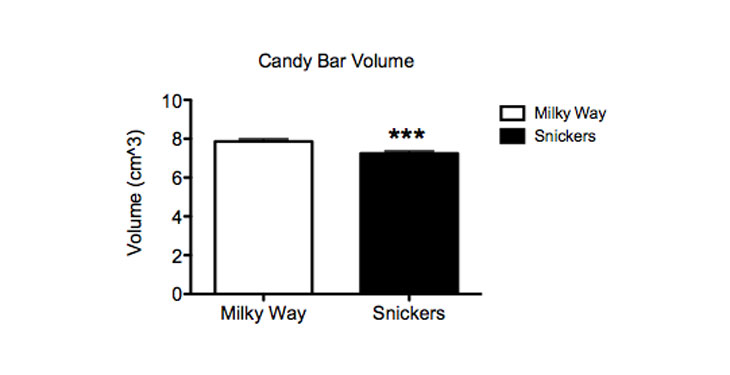
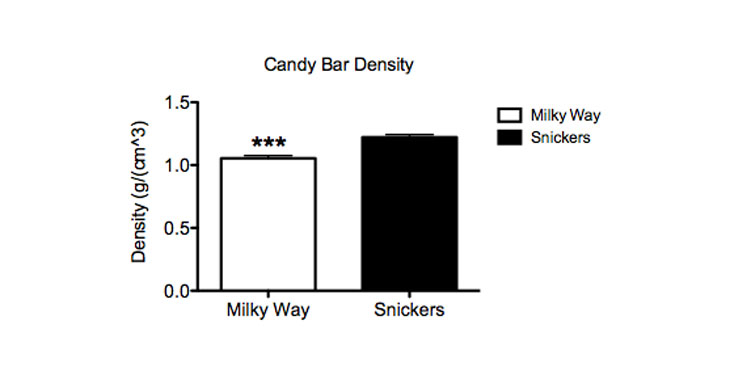
Above, I have graphed the mass, volume and density of my two chocolate varieties. The types of candy are displayed along the x axis — the horizontal line at the bottom of the graph. The numbers for mass, volume and density are on the y axis — the vertical line on the left side. Above each bar there is a little “T” shape. This represents a measure of how much the data might spread if I were to sample every single Milky Way or Snickers in the world. (This value is known as the standard error of the mean.)
There are also asterisks in each graph. One asterisk means a p value of less than 0.05; two asterisks mean the p value is less than 0.01; three asterisks mean a p value of less than 0.001.
My Snickers bars had significantly more mass than my Milky Ways. Their volume also was smaller. And when I calculated the density, the Snickers bars were, therefore, measurably denser than the Milky Ways.
Float on
Now, I need to confirm that the Snickers bars were denser in the water bath. And I did this by confirming they need more salt to float than do the Milky Ways.
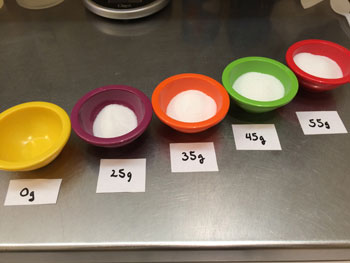
After filling two clear plastic cups with the same amount of water, I weighed each cup to make sure they were equal. Then I submerged each candy bar, one at a time. I wrote down whether it floated or sank. I started with plain water. Then, I added 25 grams (0.88 ounce) of salt to each cup of water, and stirred well until all of the salt had dissolved. Again, I put each candy bar in, and recorded whether it floated or sank. I marked a 0 for sink, and a 1 for float. I repeated these steps for each candy bar as I upped the salt to a total of 35 grams, then 45 grams, and finally 55 grams.

Finally, I added up how many of each type of chocolate floated at each concentration of salt. By dividing the floating bars by the total number (26 per group), I could calculate the percent of candy bars that floated I used statistical analyses again (this time, using a test called an
Analysis of Variance, or ANOVA
) to find out whether the percent of Milky Ways floating was significantly different from the percent of Snickers that floated.
The graph below shows what percentage of each chocolate floated in each concentration of salt. You can see that none floated before adding salt to the water. At 25 and at 35 grams of salt, more candies floated, but there was no difference between the Milky Ways and the Snickers. Things changed at 45 grams of salt: Now, 88 percent of my Milky Ways were floating, while only 40 percent of my Snickers did. This difference was statistically significant. By 55 grams of salt, virtually every candy bar was able to float.
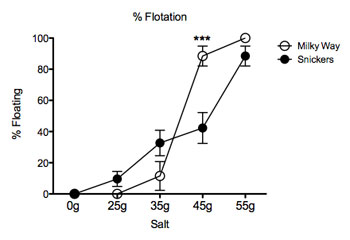
This supported my hypothesis. Snickers indeed are denser than Milky Ways, and require more salt to float in water.
Now it’s your turn. Use whatever candies you like (as long as they won’t start dissolving in water). What were your results? Share them below.
Note: The idea for this experiment came from the great book Candy Experiments 2, by Loralee Leavitt. This book has loads of chemistry demonstrations, all featuring candy!
Follow Eureka! Lab on Twitter
Power Words
(for more about Power Words, click here)
ANOVA The acronym for analysis of variance, a statistical test to probe for differences between more than two test conditions.
density A measure how condensed an object is, found by dividing the mass by the volume.
hypothesis A proposed explanation for a phenomenon. In science, a hypothesis is an idea that must be rigorously tested before it is accepted or rejected.
mass A number that shows how much an object resists speeding up and slowing down — basically a measure of how much matter that object is made from. For objects on Earth, we know the mass as “weight.”
mean One of several measures of the “average size” of a data set. Most commonly used is the arithmetic mean, obtained by adding the data and dividing by the number of data points.
standard deviation (in statistics) The amount that each set of data varies from the mean.
standard error of the mean (in statistics)The probable distribution of numbers based on a random sample.
statistics The practice or science of collecting and analyzing numerical data in large quantities and interpreting their meaning. Much of this work involves reducing errors that might be attributable to random variation. A professional who works in this field is called a statistician.
statistical analysis Mathematical processes that allow a scientists to make conclusions from a set of data.
statistical significance In research, a result is significant (from a statistical point of view) if the likelihood that an observed difference between two or more conditions would not be due to chance. Obtaining a result that is statistically significant means there is a very high likelihood that any difference that is measured was not the result of random accidents.
Student’s t test A mathematical test used to determine if two sets of numbers are significantly different from each other.
x axis (in mathematics) The horizontal line at the bottom of a graph, which can be labeled to give information about what the graph represents.
y axis(in mathematics) The vertical line to the left or right of a graph, which can be labeled to give information about what the graph represents.