How kids ‘see’ scientists depends on what they read
Asking kids to draw a scientist reveals their influences

Whether kids draw an accurate scientist or a mad scientist depends on where they get their inspiration.
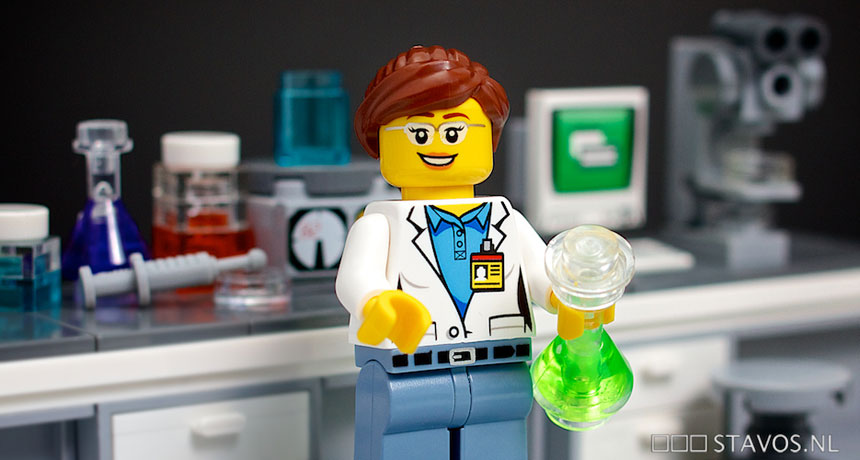
Stavos/Flickr/(CC BY-NC-ND 2.0)
Please draw a scientist. Go on. I’ll wait.
Okay. What did you draw? Was it an old man with frizzy white hair, surrounded by equations? Maybe it was someone in a lab coat with glass tubes full of chemicals? Or maybe you drew a mad scientist attaching laser guns to a dinosaur. Whatever you drew, it probably had a lot to do with what you have read or seen about scientists. A new study finds that when kids are asked to draw scientists, those images will reflect how they’ve seen researchers depicted before. Those images, from books, movies and more may stay with kids, and even play a role in whether they decide to become scientists themselves.
Junqing Zhai and his colleagues at Zhejiang University in China had asked elementary school kids about science. These children frequently mentioned “fictional movies and science documentary TV programs.” Afterward, Zhai began to wonder how strong the influence of such media had been in affecting what kids think about scientists.
To find out, his team asked 266 boys and girls in Singapore to draw a scientist. All the kids were 9 or 10 years old. The researchers then sorted their drawings into four types.

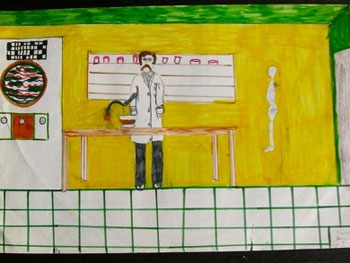
Half of the students drew a realistic looking chemist — someone with beakers and test tubes. Another 22 percent drew other realistic versions of scientists, whether they were looking at Mars or digging up dinosaur bones. About eight percent of the kids drew the school-like scientist. But 18 percent of the kids — mostly boys — drew some sort of “mad” scientist.
See real scientists? Draw real scientists
But Zhai and his group weren’t done yet. They asked the students where ideas for their drawings had come from. Was it TV program, a cartoon, a science book or some teacher, for instance?
Those who listed only school sources as their inspiration (such as textbooks and science magazines) were more likely to draw a realistic scientist. Kids who listed only videogames and movies as their sources were more likely to draw a mad scientist. Overall, girls were more likely than boys were to draw a realistic scientist.
In the end, Zhai’s team found, most kids had based their drawings on science books and magazines. “Honestly, we were a bit shocked,” says Zhai. “We thought Internet and TV programs should be the most influential media on a student’s image of a scientist.” But classroom sources do make sense. “Books (especially textbooks) are the main sources that students can get access to.” Zhai and his group published their findings November 18 in the journal Public Understanding of Science.
It’s important for students to get a correct view of what scientists do as early as possible, says Zhai. If they picture what scientists do as negative, he notes, they might decide to stay away from science itself.
This means that kids need accurate portrayals, Zhai says. That won’t just mean putting diverse images of scientists into books and magazines. That also can mean recognizing which portrayals aren’t so great. We all need to recognize that while mad scientists may be fun, they aren’t real.
Most students mentioned science magazines and TV shows, but that doesn’t let entertainment media off the hook, says Becky Francis. She studies education at King’s College London in England. “One of the mainstays of where children are getting these ideas is from the media,” she says. So entertainment programs have a responsibility to show real scientists, too, and stop filling kids’ entertainment with bad-guy scientists or doing silly things like attaching laser beams to shark heads.
What about you?
You can repeat this experiment yourself. Ask a group of fellow students to draw scientists. Then ask them where they got the idea for what that person should look like. You can rank their inspirations from one to five, where one is very non-scientific (such as a videogame), and five is very scientific (such as a science magazine).
Then, rank the drawings. Use a five-point scale, where five is most accurate and one is least accurate.
You now have two sets of numbers, one for the drawing and one for the inspiration. Using these sets of numbers, you can calculate a correlation — or whether there is a relationship between a drawing and its inspiration.
To do this, you can enter your numbers into a free online calculator. Enter the rankings for the drawings in one column and rankings for the inspirations in the other. Make sure that both rankings are in the same order.
When you hit “calculate,” you will get a measure labeled “R.” This is a correlation coefficient. That’s a measure of how closely related the two sets of numbers are. This number will be between +1 and -1. A correlation coefficient of zero means there is no link between two sets of numbers. A coefficient of +1 would mean that an increase in one variable is always associated with an increase in the other: This is known as a positive correlation. A correlation coefficient of -1 would mean that an increase in one set of numbers is always associated with a decrease in the other set.
You can then use that correlation coefficient in the same online calculator to find out if your correlation is statistically significant. This means that it is unlikely to be just an accident, or fluke. All you need to do is go back to the online calculator, put in the “R” measure, and then add in your “N” — a symbol scientists use to refer to how many samples they took. In this case, your N is how many people made drawings of scientists.
This calculator will give you a number called a p value. This is a measure of how likely it is you would see this correlation if it didn’t really exist. Scientists usually conclude that a p value of less than 5 percent (written 0.05) is statistically significant.
Did you try it? What did you get? And what scientist did you draw and why? Please leave your results in the comments.
Follow Eureka! Lab on Twitter
Power Words
(for more about Power Words, click here)
chemistry The field of science that deals with the composition, structure and properties of substances and how they interact with one another. Chemists use this knowledge to study unfamiliar substances, to reproduce large quantities of useful substances or to design and create new and useful substances. (about compounds) The term is used to refer to the recipe of a compound, the way it’s produced or some of its properties.
correlation A mutual relationship or connection between two variables. When there is a positive correlation, an increase in one variable is associated with an increase in the other. (For instance, scientists might correlate an increase in time spent watching TV with an increase in risk of obesity.) Where there is an inverse correlation, an increase in one value is associated with a decrease in the other. (Scientists might correlate an increase in TV watching with a decrease in time spent exercising each week.) A correlation between two variables does not necessarily mean one is causing the other.
documentary A type of movie or television program that takes its name from the fact that it attempts to document actual real-life events.
fiction (adj. fictional) An idea or a story that is made-up, not a depiction of real events.
Mars The fourth planet from the sun, just one planet out from Earth. Like Earth, it has seasons and moisture. But its diameter is only about half as big as Earth’s.
p value (in research and statistics) This is the probability of seeing a difference as big or bigger than the one observed if there is no effect of the variable being tested. Scientists generally conclude that a p value of less than five percent (written 0.05) is statistically significant, or unlikely to occur due to some factor other than the one tested.
statistical analysis A mathematical process that allows scientists to draw conclusions from a set of data. In research, a result is significant (from a statistical point of view) if the observed difference between two or more conditions is unlikely to be due to chance. Obtaining a result that is statistically significant means that it is unlikely to observe that much of a difference if there really is no effect of the conditions being measured.
statistical significance In research, a result is significant (from a statistical point of view) if the likelihood that an observed difference between two or more conditions would not be due to chance. Obtaining a result that is statistically significant means there is a very high likelihood that any difference that is measured was not the result of random accidents.
statistics The practice or science of collecting and analyzing numerical data in large quantities and interpreting their meaning. Much of this work involves reducing errors that might be attributable to random variation. A professional who works in this field is called a statistician.