Scientists Say: X-axis

X marks the spot, and tells you what a graph shows

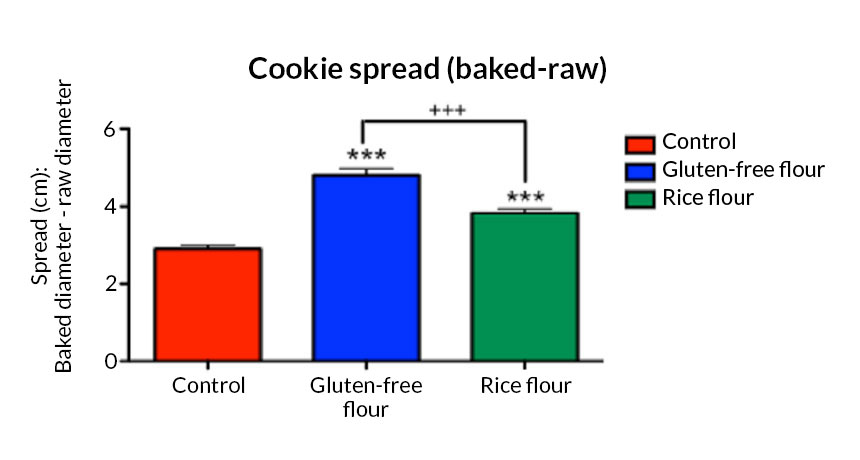
This graph shows how much cookies spread when baking. The x-axis identifies what’s in each cookie type. 

B. Brookshire/SSP

x-axis (noun, “Ex AXE-iss”)

A horizontal line on a graph. It is usually located at the bottom of the graph but can also be at the top or in the middle. Scientists label the x-axis with whatever they are measuring. This might be a list of different items measured. Or it can be a series of numbers that help to show how a variable changes over time.

In a sentence

When I graphed how “chewy” people thought cookies were, I put the ingredients in each cookie on the x-axis.  

Follow Eureka! Lab on Twitter

Power Words

(for more about Power Words, click here)

axis   The line about which something rotates. On a wheel, the axis would go straight through the center and stick out on either side. (in mathematics) An axis is a line to the side or bottom of a graph; it is labeled to explain the graph’s meaning and the units of measurement.

x-axis   (in mathematics) The horizontal line at the bottom of a graph, which can be labeled to give information about what the graph represents.

y-axis   (in mathematics) The vertical line to the left or right of a graph, which can be labeled to give information about what the graph represents.

Bethany Brookshire was a longtime staff writer at Science News Explores and is the author of the book Pests: How Humans Create Animal Villains. She has a Ph.D. in physiology and pharmacology and likes to write about neuroscience, biology, climate and more. She thinks Porgs are an invasive species.

Use up and down arrow keys to explore.Use right arrow key to move into the list.Use left arrow key to move back to the parent list.Use tab key to enter the current list item.Use escape to exit the menu.Use the Shift key with the Tab key to tab back to the search input.