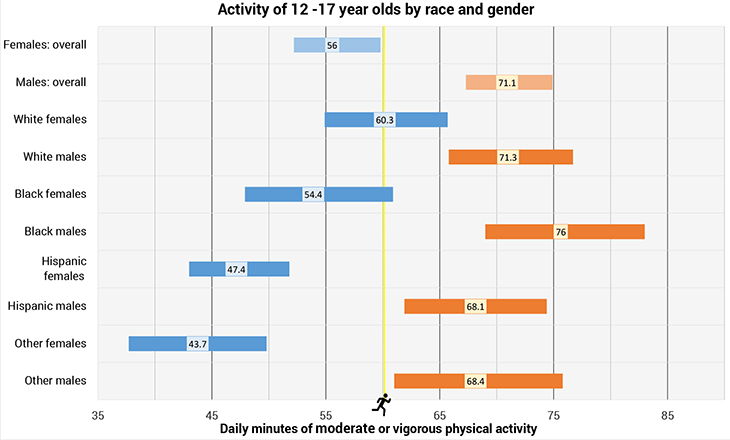
Analyze This: Most teen girls don’t meet guidelines for daily exercise
African-American boys tend to be the most active

Playing a sport like basketball is a great way to get exercise, but many teens aren’t getting the recommended daily amount of healthful activity.
monkeybusinessimages/iStockphoto
An active lifestyle is important for health. Making it habit, however, can be hard for some teens. Certain groups seem to do better than others at making exercise part of their regular routines. Those needing the most improvement, here: girls!
Sarah Armstrong studies human health and behavior at Duke University’s clinical research institute in Durham, N.C. She and her colleagues wanted to better understand how active teens and young adults were. Teens should get at least 60 minutes of moderate to vigorous exercise each day, the U.S. Department of Health and Human Services recommends. This might include walking briskly, bicycling or playing a sport. Armstrong’s group wanted to know how many teens met that goal.
The researchers started with data from the National Health and Nutrition Examination Survey (NHANES). It collects information about the health, habits and diet of a representative cross-section of the U.S. population. The team focused on kids 12 to 17. It noted how much activity each said they got each day.
Many teens reported being fairly sedentary. Girls tended to be least active. Boys were generally more active. Overall, African-American boys were most active.
These data could guide future research about the role of physical activity in teen health. They might also suggest which segments of the teen population to target with programs aimed at getting them to move their bodies more.

Click here for a larger chart.
Data Dive:
- The U.S. Department of Health and Human Services recommends that teens get at least 60 minutes of moderate to vigorous physical activity each day.
- Examine the chart (larger version here). Which groups met this requirement?
- Which groups averaged less than 60 minutes of activity per day?
- Estimate how much time you spend being physically active each day.
- Look at the data for your group (gender and ethnicity). How does this compare with how much daily activity you report getting? How does this compare with what the government recommends?
- Are there other variables that might change how active a teen can be that aren’t explained in these data? Explain.
- By ethnic group, calculate how much more exercise the boys were getting compared to girls (figure it on a percent basis). Show your work.
- From the graph above, you can’t know how the students got their physical activity. It could be useful in understanding when, where and why they moved as much or as little as they reported. So, if you could talk to the students who took part in this survey, what more would you like to know about the type and amount of physical activity they were getting? Craft at least three additional questions that you would have had the NHANES survey ask them.
Beyond the Data:
Keep track of your daily physical activity for a week. Then compare your initial estimate (from question 2 above) with the data you gathered. Was there a day that you forgot to record how active you were? Do you think you under- or overestimated how active you were?
Analyze This! explores science through data, graphs, visualizations and more. Have a comment or a suggestion for a future post? Send an email to sns@sciencenews.org.


