Analyze This: Corals stash microplastics in their skeletons
Worldwide, corals may store millions of kilograms of plastic

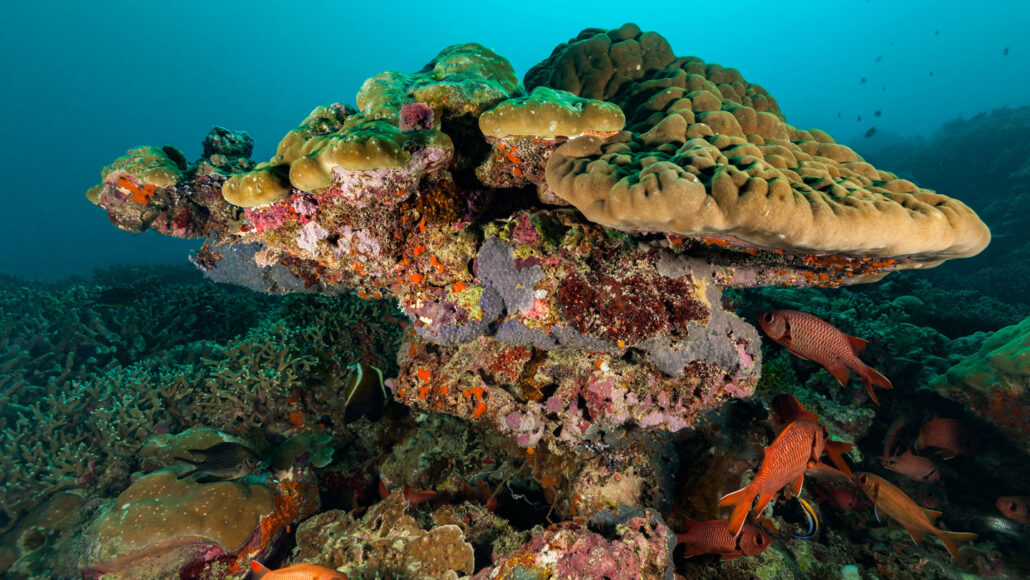
Reef-building corals can hang on to a lot of plastic, a new study finds. Researchers grew corals in the lab. They watched to see how many tiny pieces of plastic the animals took up over 18 months.
ifish/istock/getty images plus
Plastic pollution is piling up all over Earth and entering the oceans too. That includes tiny bits called microplastics. These are pieces that are about the size of a grain of rice or smaller. Now, researchers have found that corals stash a surprising amount of those tiny plastic shreds in their tissues and skeletons.
Millions of metric tons of plastic may find its way into the ocean every year. But the amount of plastic floating in seawater seems too low compared with what gets into the oceans. Researchers don’t yet know where all that missing plastic goes. But one destination may be corals. Researchers have actually seen some corals munching on plastics. But it isn’t clear if that’s the only way plastics get into corals and whether corals hang onto plastic for a long time.
Jessica Reichert is an ecologist at Justus Liebig University Giessen in Germany. In the lab, Reichert’s team grew four species of coral that build reefs. For 18 months, the researchers exposed these creatures to pieces of black polyethylene. This is one of the most common plastics in the ocean. It’s used in bags and bottles. The black color made the plastic easy to see when corals gobbled it up or grew their skeletons over it.
At the end of the experiment, the researchers tallied up how much plastic the corals took in. Most plastic debris inside corals was in their skeletons rather than tissues. The researchers shared these results October 28 in Global Change Biology.
The researchers then estimated how much plastic corals might be accumulating worldwide. Their calculations suggest that corals may cache between almost 6 billion and 7 quadrillion microplastic pieces each year. That could be up to 20 million kilograms (44 million pounds) of plastic, Reichert told Science News. That’s the weight of 10,000 cars. It’s not clear yet how those plastic fragments impact reefs. Corals already face dangers due to warming waters and ocean acidification. Microplastics “might pose an additional threat to coral reefs worldwide,” Reichert said.
A plastic tally
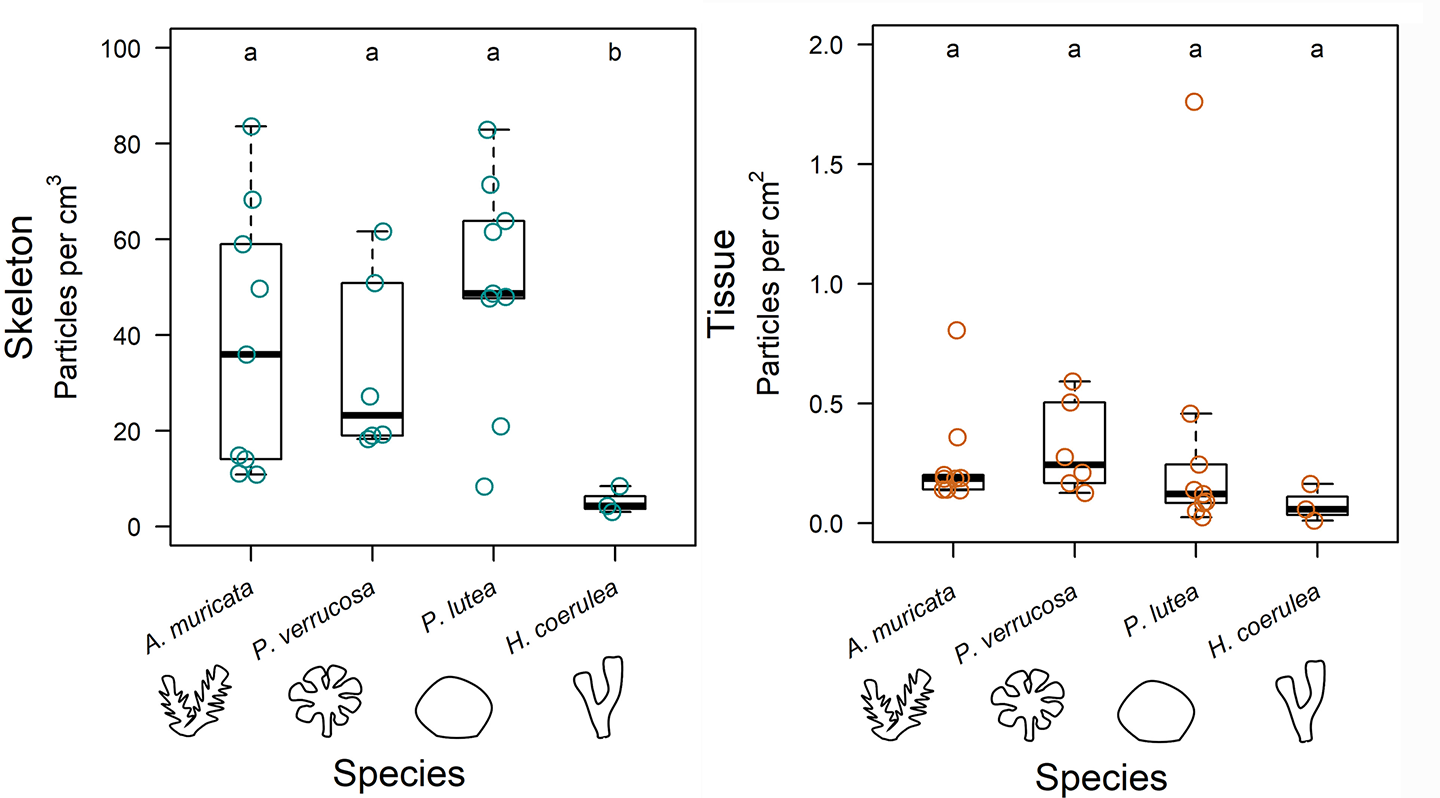
These graphs show how much plastic corals took into their tissue (right graph) or their skeletons (left graph). These “box and whisker plots” show how data is distributed over a range. Each orange or aqua circle represents a data point collected from an individual coral. The thick line in the middle of the box is the middle value (the median) if all the observations were lined up smallest to largest. The box contains the half of the data that falls in the middle when the values are lined up. So the highest quarter of values and lowest quarter of values fall outside the box. The “whiskers” represent the values that most of the data is likely to lie between. Data points outside of the whiskers are called “outliers.”

Data Dive:
- What are the highest and lowest values for how much plastic each of the four corals took into their tissue? What are the median values (marked by the dark black lines)?
- What are the highest and lowest values for how much plastic each of the four corals held in their skeletons? What are the median values?
- How would you go about finding the average of values for either the tissue or skeleton for any given species? Can you do that from these graphs?
- For each species, roughly how much more plastic was in the skeletons than the tissue?
- In the two graphs, which values are outliers? How far are these values away from the median?
- What’s another way you could show this data?
- In this experiment, all the corals were exposed to the same type and amount of microplastic. How might the experiment setup be changed to more closely reflect what happens in the ocean?


