Energy companies triggered quakes, study says
Injecting carbon dioxide underground can trigger a troubling side effect
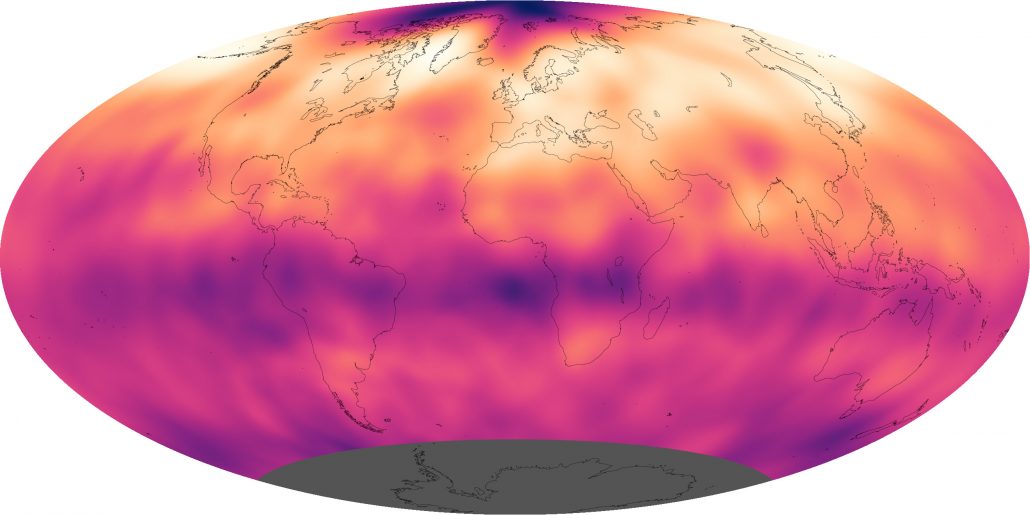
This map shows levels of CO2 in the part of the atmosphere where most weather occurs. Lighter colors indicate higher levels (up to 402 parts per million) while darker colors indicate lower levels (down to 391 parts per million). Data used to create this map were recorded in May 2013. At that time, CO2 was at its highest level in 800,000 years.
NASA Earth Observatory image by Rob Simmon and Jesse Allen with data courtesy the AIRS science team


