Analyze This: Jupiter’s Great Red Spot is shrinking
If the windstorm keeps dwindling, it could someday disappear
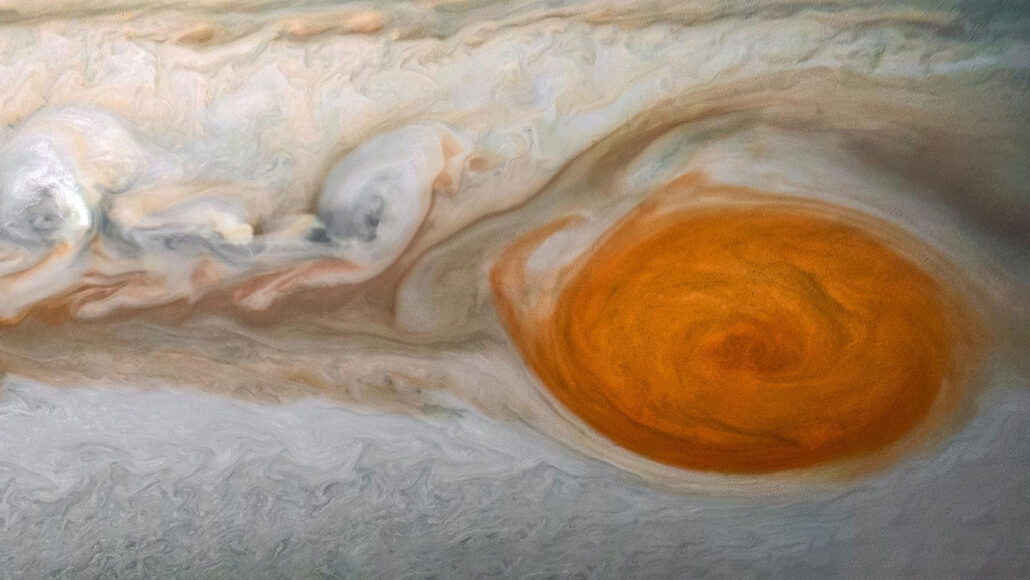
Records of a spot on Jupiter in the vicinity of the Great Red Spot (pictured) go back hundreds of years. New research reveals that today’s Great Red Spot is not the same as a spot seen in the 1600s. That spot vanished and, someday, the Great Red Spot could too.
Image data: NASA/JPL-Caltech/SwRI/MSSS; Image processing: Kevin M. Gill, © (CC BY)
Centuries ago, astronomers observed a dark oval — nicknamed the Permanent Spot — on Jupiter. It was located at the same latitude, or distance from Jupiter’s equator, where the giant windstorm known as the Great Red Spot swirls today. Researchers have wondered whether these spots are the same. Now, a new study suggests the spots are distinct — and hints at what could become of the Great Red Spot.
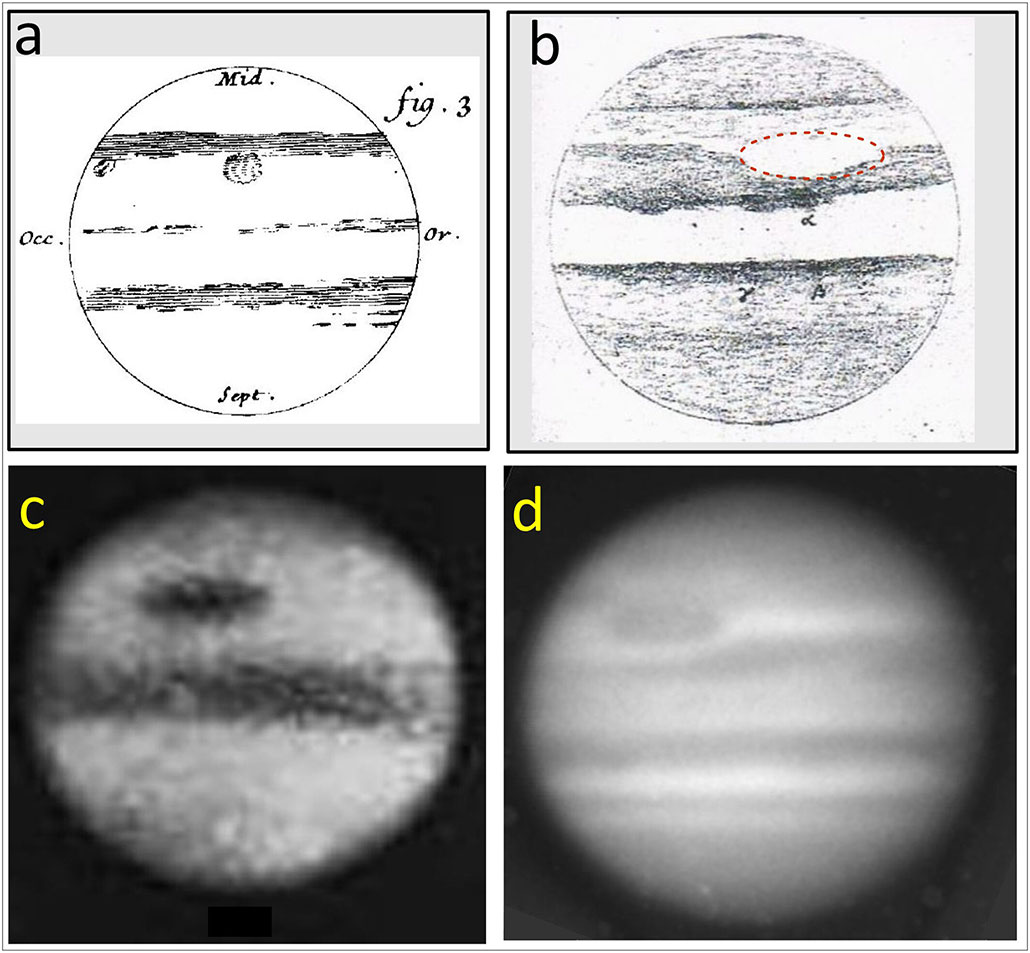
Agustín Sánchez‐Lavega and his colleagues dug through historical observations of Jupiter’s spots. These records dated back to the 1600s. Today, telescopes can take pictures of objects in space. But hundreds of years ago, Jupiter’s observers sketched what they saw through their telescopes.
“It was very exciting to see in old articles and books the descriptions of the observations and drawings that astronomers made with great precision 375 years ago,” says Sánchez‐Lavega. An astronomer and planetary scientist, he works at the University of the Basque Country in Bilbao, Spain.
The Permanent Spot appears in observations of Jupiter made from 1665 to 1713. But starting in 1713, reports of Jupiter bore no signs of this feature. Then, in 1831 and the following decades, drawings of Jupiter showed a spot resembling the Great Red Spot. At first, it appeared as a clear oval. In later records, it was drawn with a red tint.
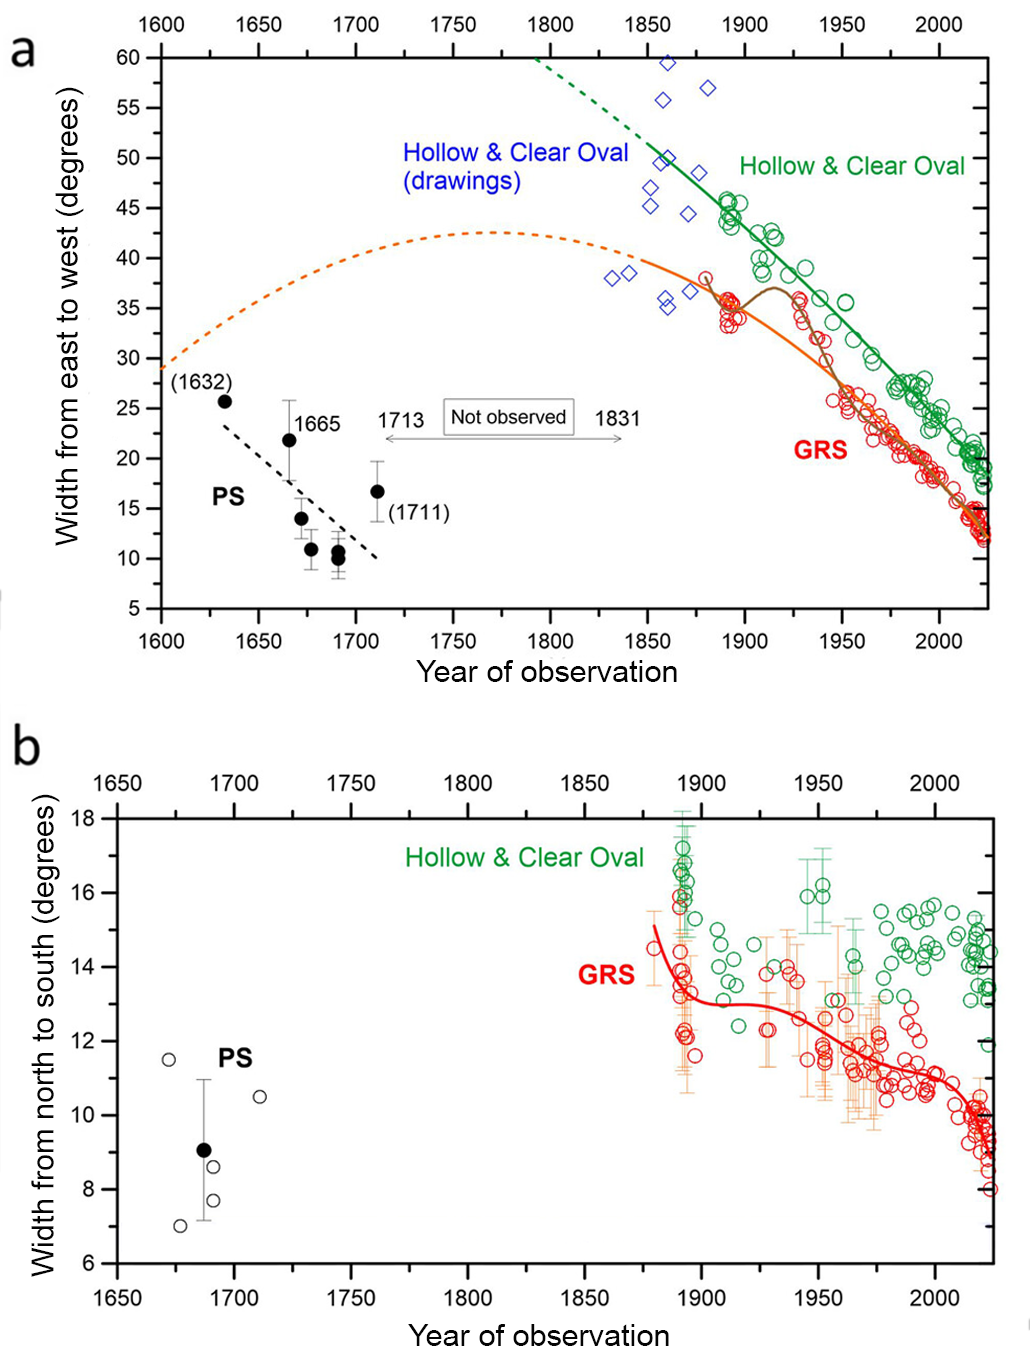
Sánchez‐Lavega’s team also tracked the spots’ sizes and shapes from 1665 to 2023. They measured the Permanent Spot from centuries-old drawings. Those data suggested that this spot’s length was two to three times smaller than that of the Great Red Spot. They got the Great Red Spot’s size from a photograph taken in 1879.
It seems that naming the earlier feature the “Permanent Spot” was a bad call. Its absence in the record for 118 years and its small size suggest it may have vanished before the current Great Red Spot emerged. The researchers shared their findings June 16 in Geophysical Research Letters.
The Great Red Spot has been shrinking since it was spotted in the 1800s. It’s now about the size of the long-lost Permanent Spot. And it may share that spot’s fate. If the Great Red Spot keeps getting smaller, there are two possibilities. It could reach a new stable size or it could disappear, the researchers say.
“We’re in some ways lucky that we get to observe this storm now,” says Amy Simon. A planetary scientist, she works at NASA’s Goddard Space Flight Center in Greenbelt, Md. She was not part of the new study. “It’s been stable for a long time, but it’s changing and there’s nothing to say that it can’t break apart tomorrow. It could be that 30 years from now there is no Great Red Spot.”
Data Dive:
- Look at Figure A. What was the Permanent Spot’s width from east to west in 1632? How did its width change in the late 1600s and early 1700s?
- How wide from east to west was the Great Red Spot in 1875? How wide was it in 2020?
- Look at Figure B. The black dot gives the average width for the Permanent Spot from north to south. How does this value compare with the individual observations of the spot’s width (open circles)?
- How has the width of the Great Red Spot from north to south changed from 1875 to 2024?
- Based on the changes to the Great Red Spot’s width (from east to west and north to south), what is happening to its overall area?


