Laser vision reveals hidden worlds
Mapping technology lets researchers see what the naked eye cannot
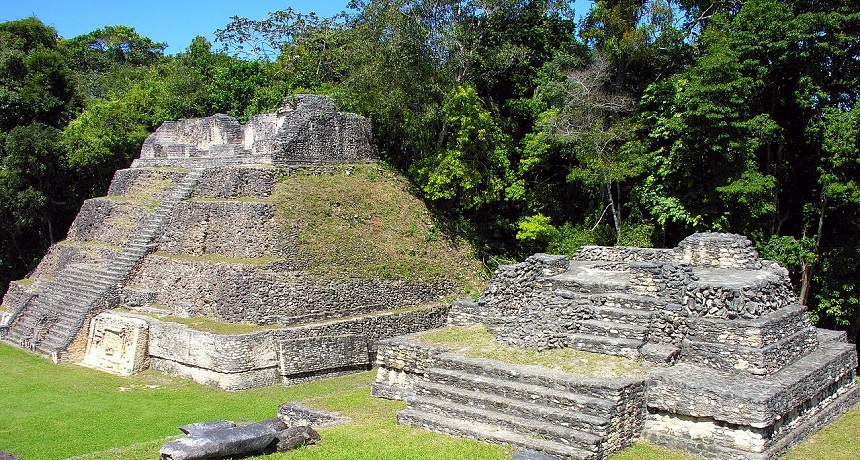
Some of the central pyramids of ancient Caracol in Belize. Laser mapping showed that at its peak, this Mayan metropolis sprawled over an area the size of present-day Washington, D.C.
Dennis Jarvis / Flickr (CC BY-SA 2.0)
In the ancient Maya city of Caracol, map-making can be treacherous. Jungles shroud this site in the Central American nation of Belize. Dense shrubs stand taller than a person’s head. They hide ruins that otherwise would be obvious. To reveal the city, archeologists must hack through the growth, using sharp blades called machetes. They step carefully to avoid critters like the fer-de-lance, a common viper with an often-fatal bite.
Arlen and Diane Chase know these hazards well. These archeologists work at the University of Central Florida in Orlando. For three decades, the husband-and-wife team (who cut their wedding cake with a machete) also have patiently studied Caracol. Season by season, they and their team — and later, their children — have hacked and mapped, hacked and mapped.
Then, in April 2009, everything changed. That’s when lidar came to Caracol. Lidar stands for “light detection and ranging.” It’s a method of using lasers to create a map. And it revealed this part of the world in a whole new light.
For five days, a small Cessna airplane buzzed over Caracol and the surrounding region. Onboard, a device fired laser pulses at the ground. And not just a few: This machine sent billions of pulses streaming into the jungle.
Some laser pulses vanished in the heavy tree cover. Many others bounced off leaves and returned to the plane. Still others reflected off of the ground or hidden stone structures. The lidar device recorded how long it took the echo of each pulse to return. The device used those bounce times to compute how far the light had traveled. In total, it recorded more than 4 billion measurements of the jungle terrain.
Back on the ground, computer programs turned those data into a detailed map of the site. The laser pulses revealed the contours of temples and other buildings, roadways and even terraced fields. It was as if lidar had peeled back the jungle to reveal much more of Caracol than anyone had seen since the Maya city went into decline more than 1,000 years ago.
Arlen Chase said that all at once he could “see” the jungle-covered ruins he and Diane had painstakingly charted over the decades. This map also turned up many other hidden archeological features. “I couldn’t stop looking at it,” he says. “It was mind-boggling.”
From underground to outer space
Laser-built maps can reveal ruins hidden for centuries. And not only in Belize. Elsewhere around the world, lidar projects have been uncovering other hidden treasures. These observations are inspiring scientists to question what they thought they knew about how ancient civilizations lived.
Nor is archeology the only field getting a boost from lasers. Scientists use lidar anywhere a map might be useful, from high above Earth to deep below. Some experts have been charting clouds and gases in the atmosphere with lidar. Others have probed deep dark caves and the changing shapes of coastlines. The technology even has been used to map the surfaces of Mars, Mercury and the moon.
“There’s no other way to collect this kind of data,” says Andrew Fountain. A geologist at Portland State University in Oregon, Fountain has used lidar to map changes in ice-free deserts in Antarctica.
Radar devices emit invisible radio waves. Those waves that bounce back reveal the location or speed of distant objects. That is why police officers use radar guns to scout for speeders among passing cars.
Similarly, sonar devices emit sounds and listen for echoes. This method even works underwater, where sound travels farther than light or radio waves. Some animals have naturally developed a type of sonar. Both bats and dolphins can “see” in dim places by producing sounds and listening for echoes. This natural sonar is called echolocation.
In the 1970s, NASA missions used lidar to study Earth’s atmosphere. In the early 21st century, the precision of laser mapping increased and its costs dropped. Early lidar instruments fired 3,000 pulses per second of one color. Newer ones emit 900,000 pulses per second and use multiple colors. Different colors of laser light penetrate or reflect off of materials differently. So multiple lidar beams could capture more information. For example, multiple-beam data might show the types of trees and other plants in a forest.
Today, scientists can use these systems to explore hidden structures almost anywhere. At about the same time, global positioning systems, or GPS, have made it possible to link the laser maps to specific locations.
Expanding horizons
The Chases began their work at Caracol in 1985. That was long before lidar was an option. Back then, textbooks described this site as a small settlement that had played a minor role in Maya history. Gradually, the Chases started turning up hints that Caracol was much bigger than those textbooks had suggested. They found roadways leading away from the center of the ruins. They found an inscription, carved into rock, that told of the city’s history — and boasted of triumphs over powerful neighbors.
Year by year, the Chases and their team built a case that Caracol was once a powerful and important Maya capital.
“Hardly anybody believes it when they wander the countryside,” says Arlen Chase. “We had been telling our colleagues for years” that Caracol was much bigger than it looks. “But we couldn’t demonstrate it.”
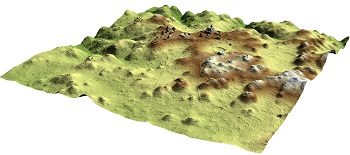
The researchers used lidar to map the terraced fields that fed the estimated 115,000 people who lived in Caracol. The maps also revealed roadways and reservoirs no one even knew had existed.
Ancient cities in the tropics
With lidar mapping, Caracol quickly morphed from a mid-size village to a major “city in the tropics,” says Arlen Chase. And before long, researchers elsewhere trained lidar on a host of other sites in Central America.
A 2013 study in Honduras spotted ruins that some speculate may be part of a legendary lost city known as La Ciudad Blanca. That year brought a second lidar survey of Caracol. It mapped more than 1,000 square kilometers (386 square miles), including much of the area surrounding the city. That survey shows that Caracol was even larger than the Chases had thought. The original city probably spilled over into what is today Guatemala.
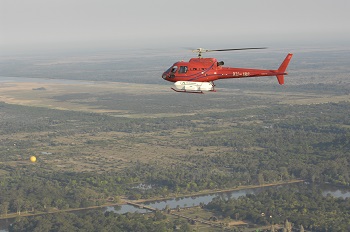
These Florida scientists are now analyzing the Caracol data for insights into the ancient Maya civilization. Arlen Chase says their latest map offers an even better sense of how the city fit within the larger Maya landscape. The Maya empire was one of the most advanced ancient civilizations in the Americas. At its peak about 1,400 years ago, its network of cities occupied parts or all of southern Mexico, Belize, El Salvador, Guatemala and Honduras.
On the Indochina Peninsula, half a world away, another major lidar project is underway. It’s probing the temples of Angkor Wat. Built in the 12th century, these are among the best-known landmarks of Cambodia. They marked the capital of a large empire that thrived between the 9th and 15th centuries. In the 600 years since then, forest has reclaimed much of what was once among the world’s largest cities.
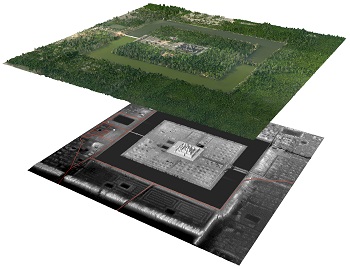
Using lidar data covering 370 square kilometers (about 180 square miles), he and his colleagues found that ancient city was — as at Caracol — much larger than researchers had believed. It also hosted a far bigger population. The map showed how the city was organized using a grid system. It also revealed the traces of farmed terraces and long-lost rice fields. All had been hiding beneath the heavy tree cover.
“The more information we get from the lidar data, the deeper our understanding of the civilization,” Evans says. “Temples and inscriptions, which are informative on certain aspects, are frustratingly silent on a range of other issues we are interested in.” Examples include learning more about how the people changed the landscape and how they made use of natural resources.
Evans has planned a second lidar study of the region later this year. It’s slated to survey an additional 1,600 square kilometers (about 620 square miles). The new study will help scientists better understand not only what the city looked like but also how it functioned. Lidar can reveal irrigation networks, for example, that supplied water to grow crops.
Lasers in the valley of the dead
The McMurdo Dry Valleys of Antarctica are the opposite of the lush jungles at Angkor Wat and Caracol. They are a frigid desert. They’re also a hotbed of lidar research.
The wide valleys lie beneath icy mountain peaks. The largest ice-free patches on the continent, these valleys cover an area almost four times as large as the city of Los Angeles. These desolate deserts are unlike anywhere else on Earth, observes Fountain, the Portland State geologist.
“It’s kind of like Death Valley or other deserts in the southwestern United States, but there are no plants,” he notes. “It’s cold, and glaciers reach in from the surrounding mountainsides.” The sun never rises very high in the sky. As a result, long shadows often stretch from the peaks across the valleys. The valley colors are stark: The sky is blue, the mountain peaks white and the ground a medium brown. Gravel blankets the valley floors. This can make walking there frustrating, like stumbling along a rugged beach, Fountain explains.
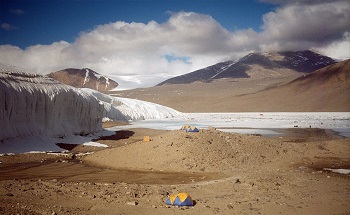
Fountain’s lidar survey of this area won’t reveal the secrets of any ancient civilization. But it might just tell scientists something about the future. He suspects the valley floors are sinking. To find out, he wants to compare the new lidar data with those collected by a NASA lidar study in 2001.
Much of the ice in Antarctica is left over from the last ice age, which ended more than 10,000 years ago. As Antarctica’s ice sheet shrank, it left behind vast stretches of ice in the valley. Over time, Fountain says, those layers of ice became covered by sediment, or rocks, sand and other material. Someone walking in the valley today wouldn’t notice the ice underneath. Over the past 10 years, however, Fountain has kept a keen eye on the buried ice. He’s seen it undergo change. Year by year, he has watched as a river cut like a knife through the underlying ice. It is a sign, he says, that the buried ice layer may be melting.
He says the sinking doesn’t seem to be connected to global warming. Indeed, temperatures in the valley have cooled in the last few decades. He expects the valley floors to sink even more, though, if surface temperatures here do climb. Using lidar to measure these changes, no matter their cause, can help him forecast how the valleys will respond to warming.
Fountain says he’ll begin analyzing his data this coming fall. Already he’s heard his map may offer some unexpected detail. Other scientists have contacted him to say they were conducting research in the valleys when the lidar plane flew over. Two said they were on the toilet. When camping in the McMurdo Dry Valleys, that means sitting on a bucket in the open air. That also means Fountain’s new and precise lidar map may feature a cameo of a scientist answering the call of nature.
“Supposedly, we’ll be able to detect these people,” he says.
Power Words
(for more about Power Words, click here)
Antarctica A continent mostly covered in ice, which sits in the southernmost part of the world.
archeology The study of human history, performed by analyzing things that ancient humans left behind, from housing materials and cooking vessels to clothing and footprints. People who work in this field are known as archeologists.
data Facts and statistics collected together for analysis but not necessarily organized in a way that give them meaning. For digital information (the type stored by computers), those data typically are numbers stored in a binary code, portrayed as strings of zeros and ones.
echo To bounce back. For example, sound bouncing off walls of a tunnel, and returning to their source. Radio waves emitted above the surface can also bounce off the bedrock underneath an ice sheet — then return to the surface.
echolocation (in animals) A behavior in which animals emit calls and then listen to the echoes that bounce back off of solid things in the environment. This behavior can be used to navigate and to find food or mates. It is the biological analog of the sonar used by submarines.
glacier A slow-moving river of ice hundreds or thousands of meters deep. Glaciers are found in mountain valleys and also form parts of ice sheets.
global positioning system Best known by its acronym GPS, this system uses a device to calculate the position of individuals or things (in terms of latitude, longitude and elevation — or altitude) from any place on the ground or in the air. The device does this by comparing how long it takes signals from different satellites to reach it.
global warming The gradual increase in the overall temperature of Earth’s atmosphere due to the greenhouse effect. This effect is caused by increased levels of carbon dioxide, chlorofluorocarbons and other gases in the air, many of them released by human activity.
ice age Earth has experienced at least five major ice ages, which are prolonged periods of unusually cold weather experienced by much of the planet. During that time, which can last hundreds to thousands of years, glaciers and ice sheets expand in size and depth. The most recent ice age peaked 21,500 years ago, but continued until about 13,000 years ago.
ice sheet The broad blanket of ice, most of it kilometers deep, that covers most of Antarctica. An ice sheet also blankets most of Greenland.
laser A device that generates an intense beam of coherent light of a single color. Lasers are used in drilling and cutting, alignment and guidance, in data storage and in surgery.
lidar (short for light detection and ranging) A tool to measure the shape and contour of the ground from the air. It bounces a laser pulse off a target and then measures the time (and distance) each pulse traveled. Those measurements reveal the relative heights of features on the ground struck by the laser pulses.
Maya A native American culture developed by people who lived between 2500 B.C. and 1500 A.D. in what is now parts of southern Mexico (its Yucatan Peninsula) and Central America. At its height (between about 250 and 900 A.D.), the density of people in some Maya cities was equal to that in Medieval Europe.
National Aeronautics and Space Administration Best known as NASA, this U.S. agency was created in 1958. Since then, it has become a leader in space research and in stimulating public interest in space exploration. It was through NASA that the United States sent people into orbit and ultimately to the moon. It has also sent research craft to study planets and other celestial objects in our solar system.
radar A system for calculating the position, distance or other important characteristic of a distant object. It works by sending out periodic radio waves that bounce off of the object and then measuring how long it takes that bounced signal to return. Radar can detect moving objects, like airplanes. It also can be used to map the shape of land — even land covered by ice.
sediment Material (such as stones and sand) deposited by water, wind or glaciers.
sonar A system for the detection of objects and for measuring the depth of water. It works by emitting sound pulses and measuring how long it takes the echoes to return.
Word Find (click here to enlarge for printing)
