Rock Candy Science 2: No such thing as too much sugar
Here’s why you need so much sugar to make rock candy
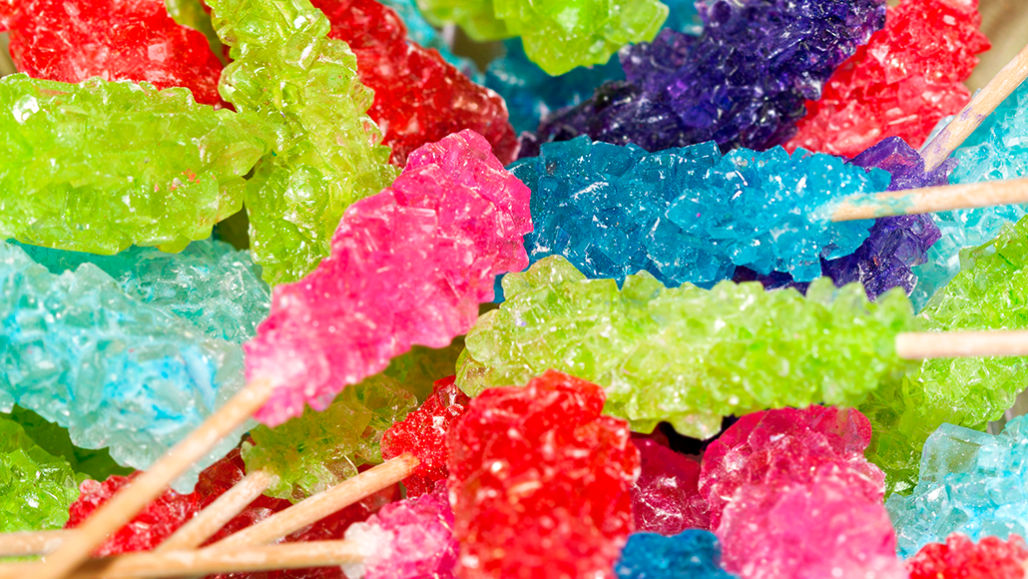
Making rock candy at home takes a lot of sugar. How much? I did an experiment to find out.
ktaylorg/iStock/Getty Images Plus
This article is one of a series of Experiments meant to teach students about how science is done, from generating a hypothesis to designing an experiment to analyzing the results with statistics. You can repeat the steps here and compare your results — or use this as inspiration to design your own experiment.
Making rock candy at home requires just two ingredients — water and sugar. A lot of sugar, as I found out when I ran a rock candy experiment in 2018 (and ran out of the sweet stuff). Most recipes recommend using about three times as much sugar as water. That’s so much, it seems like a waste. To see if I could get away with less, I ran another experiment.
Spoiler: Less sugar is not the answer.
In my previous experiment, I showed that seed crystals are very important for creating rock candy. Putting a few grains of sugar on a stick or string promotes the formation of bigger crystals. This speeds up the candy-making.
I had calculated that to make enough rock candy for that experiment, I would need to fill 52 plastic cups with a sugar solution. But the candy recipe used more sugar than I was expecting and I quickly ran out. That’s because the recipe required one kilogram (8 cups) of sugar for every 300 grams (2.7 cups) of water. That’s a sugar-to-water ratio of 3:1. In the end, I had to run my experiment with only 18 plastic cups.
It all worked out in the end and I was able to test my hypothesis. But I wondered if I could have used less sugar and more water. To find out, another experiment was in order.
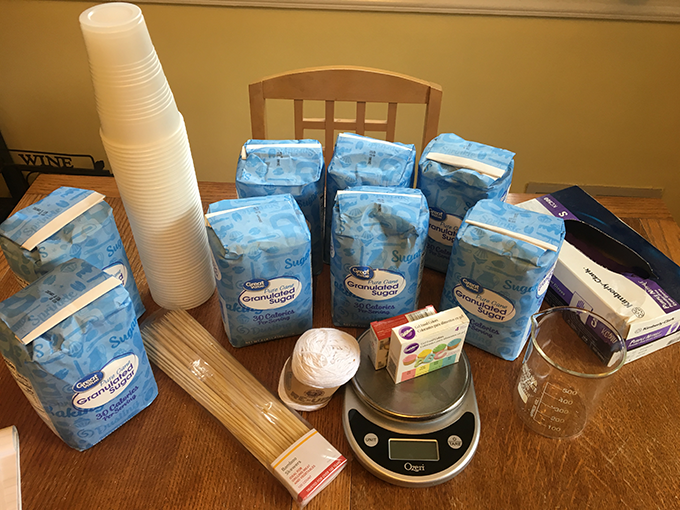
Last time I made rock candy for science, I ran out of sugar. Not this time!B. Brookshire/SSP 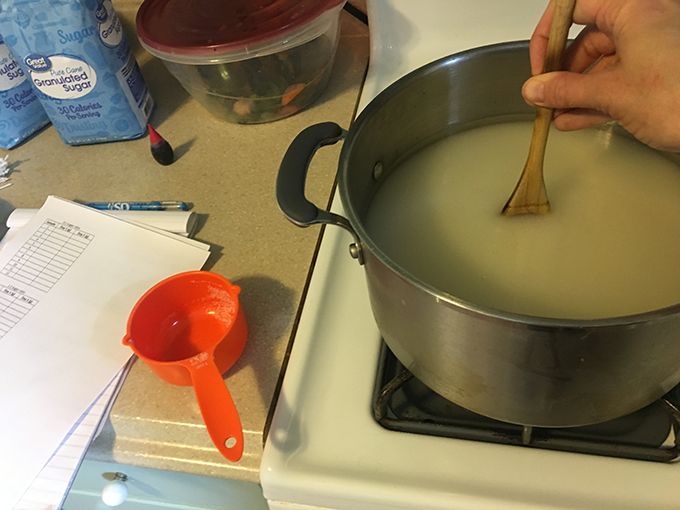
In a super-saturated sugar solution, there’s too much sugar to dissolve in the water at room temperature. Heating helps the sugar to dissolve.B. Brookshire/SSP 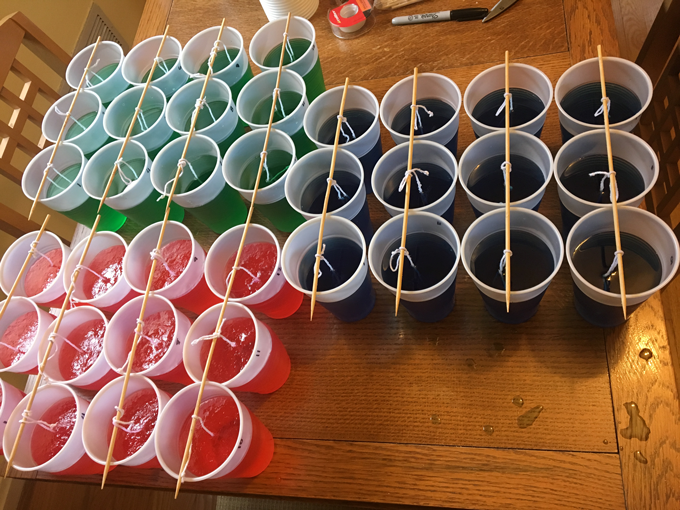
This time, I hung strings in cups instead of using sticks. It’s much easier than the method I used in my previous experiment. B. Brookshire/SSP
Super-saturated sugar
Making rock candy starts with dissolving sugar in water. The recipe’s ratio of sugar to water is so high, though, that the sugar won’t dissolve without some help. No matter how much I stir, there’s just too much sugar.
That changes when the water temperature increases. As water heats up, individual water molecules move faster and faster. Those speedy molecules can more easily break up the sugar crystals that had been dumped into the water. Soon, all the sugar dissolves in the water and the water turns clear.
This solution isn’t stable, however. It’s a super-saturated solution. The water contains more sugar than it can hold at room temperature. As the water cools, then, the sugar slowly precipitates out — becoming solid again. If the sugar crystals have something to attach to — such as a stick or piece of string with a little bit of sugar already on it — they will tend to attach there. Over time, enough sugar crystals cling together to make a chunk of rock candy.
But how super-saturated does my solution need to be to make rock candy? To figure this out, I’ll start with a statement that I can test — a hypothesis. My hypothesis is that using a lower ratio of sugar to water in my solution will produce less rock candy than a mixture with a high-sugar concentration.
Cooking candy
To test this hypothesis, I made three batches of rock candy. The first batch is my control — the original rock candy recipe with a 3:1 ratio of sugar to water, a super-saturated solution. A second batch used a sugar-to water ratio of 1:1. That solution is saturated — the sugar goes into solution with stirring and maybe a little heat. The third group has a solution with a sugar-to-water ratio of 0.33:1. This solution is not saturated; the sugar dissolves into the water at room temperature.
I can’t make only one piece of rock candy for each test condition. I need to repeat my experiment and make enough rock candy to detect a difference between the three groups. For this experiment, that meant cooking up 12 batches of rock candy for each group.
I have made rock candy for an experiment before. This time, I made a few changes:
- Measure out and cut 36 clean pieces of string. Make sure there is enough string to tie around a stick above the cup, while still leaving string to dangle into the sugar solution.
- Dip one end of the string 12.7 centimeters (5 inches) into a cup of clean water, then roll it in a small pile of sugar. Set aside to dry.
- Set out 36 plastic or glass cups.
- In a large pot, bring the water and sugar to a boil, stirring. Keep an eye on your mix. When the water comes to a boil, the sugar should pop into solution and the water will become clear.
- For your 3:1 solution, mix 512 grams (4 cups) of water and 1.5 kilograms (12 cups) of sugar. I made two batches, which ended up using about 8 cups of water and 24 cups of sugar in total.
- For the 1:1 solution, add equal amounts of sugar and water to the pot and bring to a boil. So for 12 cups of water, you would need 12 cups of sugar.
- For the 0.33:1 solution, 15 cups of water and 5 cups of sugar should be plenty.
- Once the solution is clear, add food coloring to get a desired color. I used red for my 3:1 solution, green for my 1:1 solution and blue for my 0.33:1 solution.
- If your solution is hot, you may want to wait a few minutes before pouring it into the cups. If the cups are thin, cheap plastic, the hot liquid might make them melt and sag. (This happened to me; my red cups were sad and saggy at the bottom.)
- Using a measuring cup, pour 300 milliliters (10 fluid ounces, a little more than a cup) of the solution into each cup. You may need to make another batch or two of each solution until you have enough to fill all 12 cups in each group.
- Weigh each string before you dip it into the solution. Use a scale to find the mass of each string in grams (each of mine weighed about one gram). Once you have noted the mass, dip the stick carefully into a cup of the sugar solution, then secure it in place. Make sure the string does not touch the bottom or sides of the cup. I tied each string to a wooden skewer placed across several cups.
- Put all the cups in a cool, dry place where they will not be disturbed.
- Wait. How long? You will start to see sugar crystals form after a day or so. But if you want candy to eat, you’ll want to wait at least five days.
At the end of the experiment, get out the scale again. Pull each string out of its cup, make sure it’s not dripping, and weigh it a second time. Should you eat it? Maybe not.
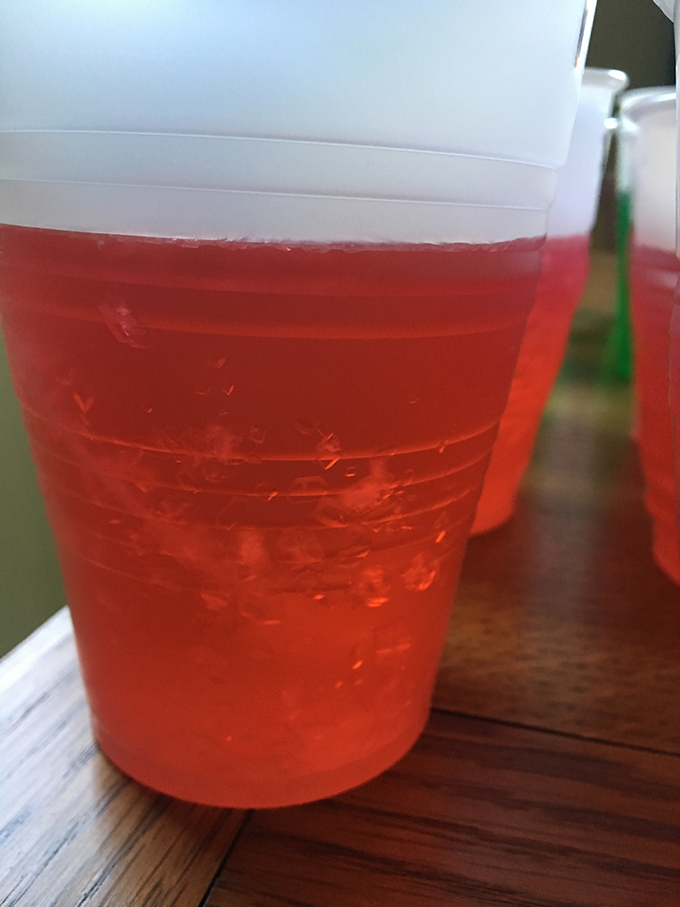
Here you can see sugar beginning to precipitate out of the solution and form crystals. B. Brookshire/SSP 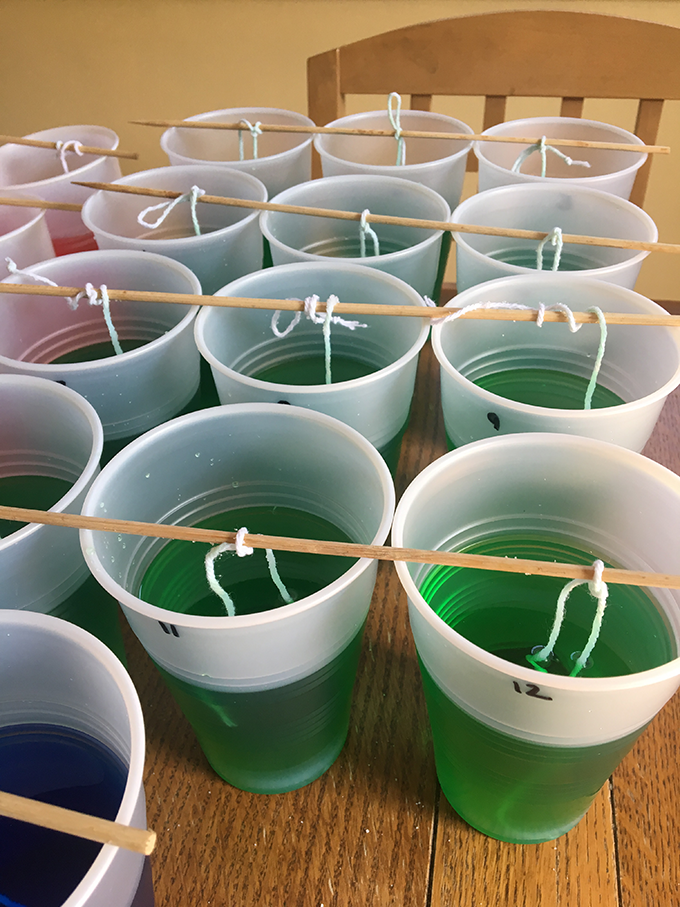
Without the super saturated solution, no crystals are visible.B. Brookshire/SSP 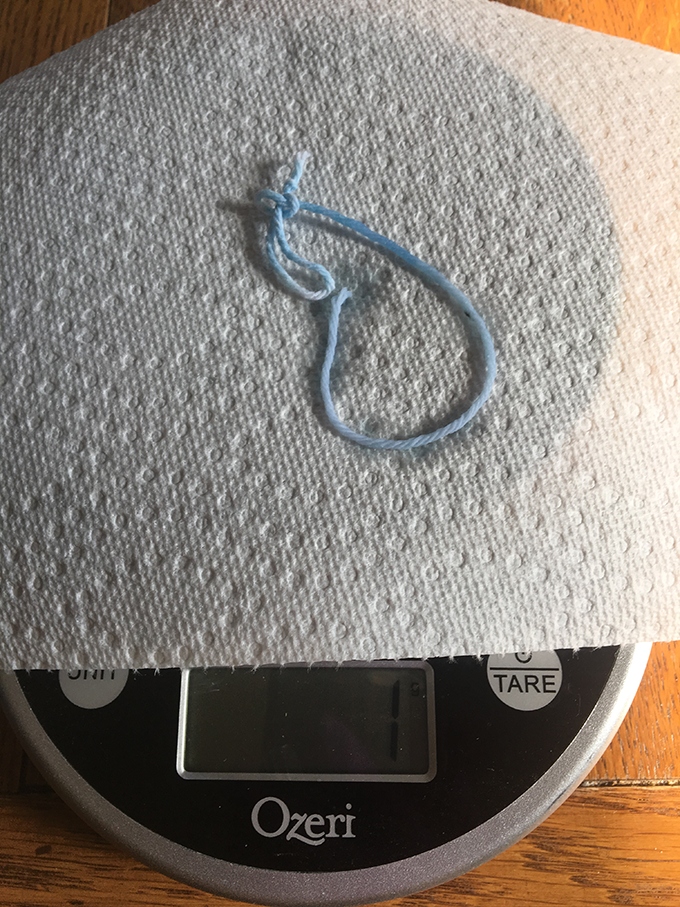
After five days, the lowest concentration, a 0.33:1 ratio, produces nothing but a wet blue string. Some strings were even moldy. B. Brookshire/SSP 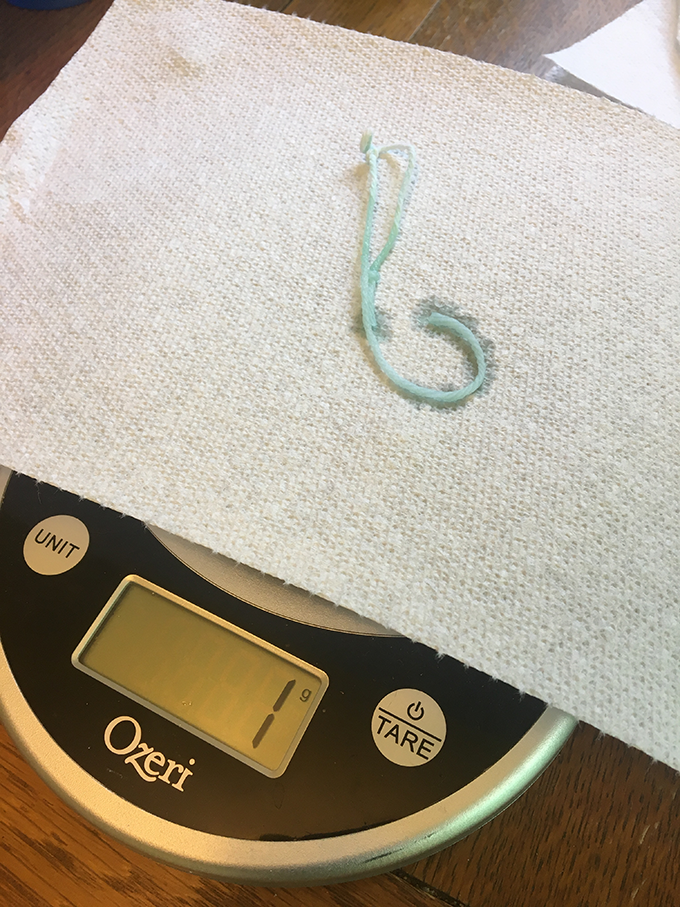
Five days later, the middle concentration, a 1:1 ratio, produces nothing but a wet green string. B. Brookshire/SSP 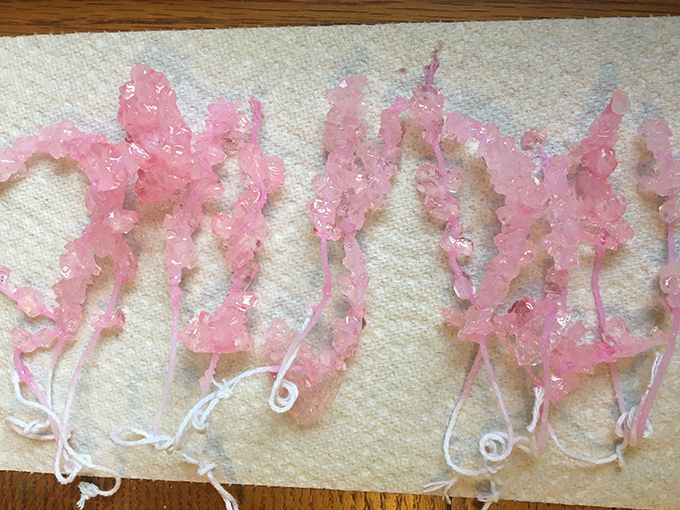
After five days, the high concentration, a 3:1 ratio of sugar to water, produces pretty pink candy. B. Brookshire/SSP
Have your data and eat it too?
To find out how much rock candy you made in each group, subtract the weight of each string at the beginning of the experiment from the weight of the candy-coated string. That will tell you how many grams of sugar crystals had grown.
At the end of my five-day experiment, I created a spreadsheet of my results, with each group getting its own column. At the bottom, I calculated the mean — the average crystal growth — for each group.
My super-saturated control group grew 10.5 grams of candy on average. The candy looked pink and tasty. But my other groups grew on average — zero grams of candy. They looked like soggy blue or green pieces of string. Some of the cups even grew mold. (Gross. Don’t eat those.)
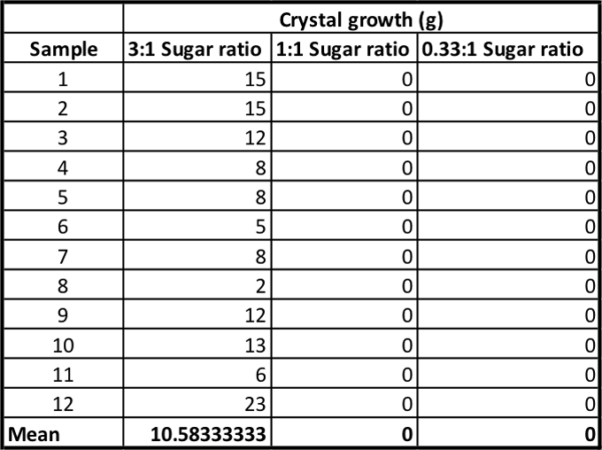
Were the three groups different from each other? It certainly seemed like the super-saturated group was different. But to be sure, I needed to run some statistics — tests that will interpret my findings.
The first test I did was an analysis of variance, or ANOVA. This test is used to compare the means of three or more groups. There are free calculators that will run this test for you online. I used the one at Good Calculators.
This test gives you two outcomes, an F-stat and a p value. An F-stat is a number that tells you if three or more groups are different from each other. The higher the F-stat, the more likely it is that the groups are different from each other in some way. My F-stat was 42.8. That’s very large; there’s a big difference between those three groups.
The p value is a measure of probability. It measures how likely it is that I would find by accident alone a differences between my three groups that was at least as big as the one I report. A p value of less than 0.05 (or five percent) is considered by many scientists to be statistically “significant.” The p value I got from Good Calculators was so small it was reported as 0. There’s a 0 percent chance that I would see a difference this large by accident.
But these are just numbers that report a difference between the three groups. They don’t tell me where the difference is. Is it between the control group and the 0.33:1 group? The 1:1 group and the 0.33:1 group? Both? Neither? I have no idea.
To learn, I need to run another test. This test is called a post-hoc test — one that lets me further analyze my data. Post-hoc tests should only be used when you have a significant result to analyze.
There are many kinds of post-hoc tests. I used Tukey’s range test. It will compare all the means between all the groups. So it will compare the 3:1 ratio against the 1:1, then 3:1 to 0.33 to 1, and finally 1:1 to 0.33 to 1. For each, the Tukey’s range test gives a p value.
My Tukey’s range test showed that the 3:1 control group was significantly different from the 1:1 (a p value of 0.01, a one percent chance of a difference). The 3:1 group was also significantly different from the 0.33:1 (a p value of 0.01). But the 1:1 and 0.33:1 groups were not different from each other (which you would expect, since both of them averaged zero crystal growth). I made a graph to show my results.
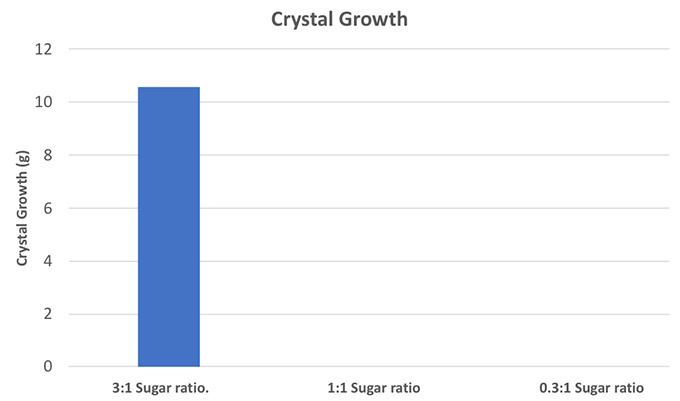
This experiment seems pretty clear: If you want rock candy, you need a lot of sugar. The super-saturated solution is a must so that the sugar can crystallize out onto your string.
But there are always things that a scientist can do better in any study. For example, I had three groups with different amounts of sugar in the water. But another good control — a group where nothing changes — would be one with no sugar in the water at all. The next time I want to make myself some candy, I’ve got another experiment to do.
Materials List
Granulated sugar (6 bags, $6.36 each)
Grill skewers (pack of 100, $4.99)
Clear plastic cups (pack of 100, $6.17)
String ($2.84)
Large pot (4 quarts, $11.99)
Measuring cups ($7.46)
Scotch tape ($1.99)
Food coloring ($3.66)
Roll of paper towels ($0.98)
Nitrile or latex gloves ($4.24)
Small digital scale ($11.85)


