Scientists Say: Y-axis

This little line can tell you a lot about what is on your graph

y axis

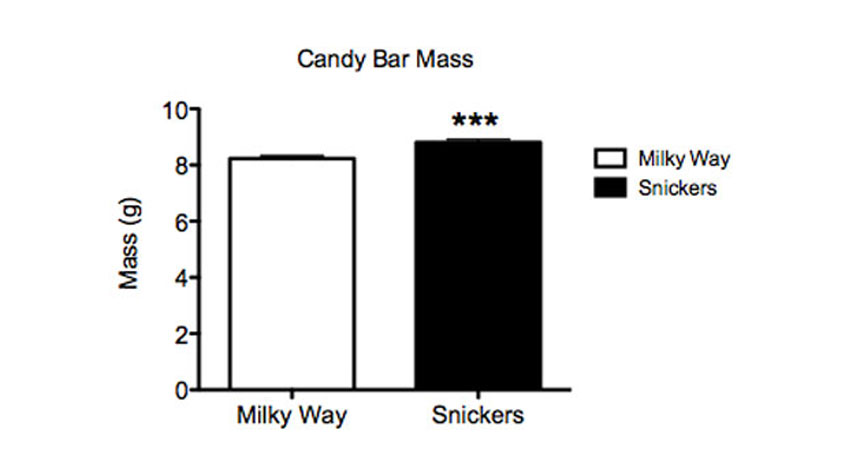
In this graph, the y axis on the left shows that the candy was measured in grams.

B. Brookshire/SSP

Y-axis (noun, “Why AXE-iss”)

A vertical line on a graph. It can be located to the right or left, or even in the middle. Scientists label the y-axis with whatever they are measuring. Perhaps it is time, or a population, or grams of a substance. The y-axis and its horizontal partner, the x-axis, tell us what data presented in the graph represents.

In a sentence

When trying to float a candy bar, my graph of the results showed the mass of the candy on the y-axis.

Follow Eureka! Lab on Twitter

Power Words

(for more about Power Words, click here)

axis   The line about which something rotates. On a wheel, the axis would go straight through the center and stick out on either side. (in mathematics) An axis is a line to the side or bottom of a graph; it is labeled to explain the graph’s meaning and the units of measurement.

x-axis   (in mathematics) The horizontal line at the bottom of a graph, which can be labeled to give information about what the graph represents.

y-axis   (in mathematics) The vertical line to the left or right of a graph, which can be labeled to give information about what the graph represents.

Bethany Brookshire was a longtime staff writer at Science News Explores and is the author of the book Pests: How Humans Create Animal Villains. She has a Ph.D. in physiology and pharmacology and likes to write about neuroscience, biology, climate and more. She thinks Porgs are an invasive species.

Use up and down arrow keys to explore.Use right arrow key to move into the list.Use left arrow key to move back to the parent list.Use tab key to enter the current list item.Use escape to exit the menu.Use the Shift key with the Tab key to tab back to the search input.