Experiment: Why does the moon look larger on the horizon?
Let’s explore Emmert’s law, which may explain this optical illusion

Have you ever noticed how the moon looks bigger on the horizon than it does overhead? Explore why in this experiment!
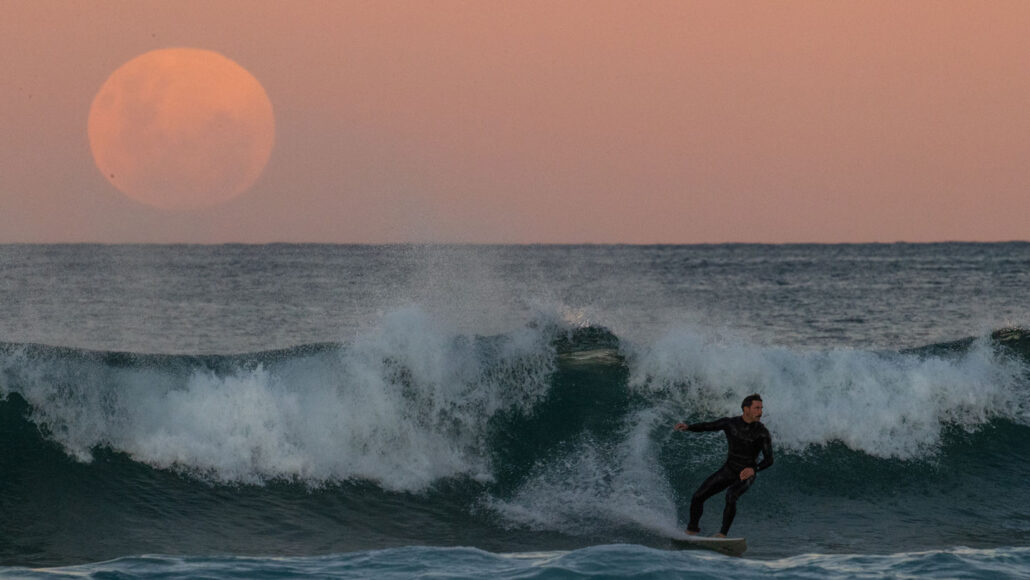
Cameron Spencer/Staff/Getty Images News
Objective: Investigate Emmert’s law to determine the perceived increase in size of the moon at the horizon
Areas of science: Human Biology
Difficulty: Easy advanced
Time required: 2–5 days
Prerequisites: You will need access to an outside area with a clear view of the horizon and the sky overhead
Material availability: Readily available
Cost: Under $20
Safety: No issues
Credits: David B. Whyte, PhD, Science Buddies
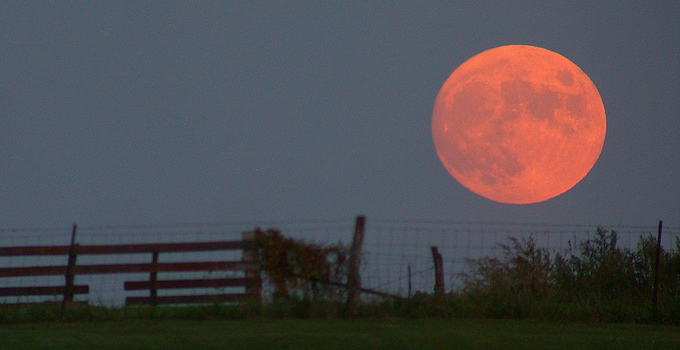
A full moon rising over the horizon, like the one shown in Figure 1, often appears to be unusually large. Many people will say that the moon gets smaller as it moves higher up in the sky above the horizon. Actually, the angular size of the moon, which is about 0.5 degrees, is the same wherever it is in the sky.
For comparison, the tip of your little finger, when your hand is held at arm’s length, is about 1 degree. Angular size is measured in degrees, with 360 degrees equaling a full circle. An object’s angular size is the angle between the lines of sight to its two opposite sides. For example, the angular size of the sky is about 180 degrees. An object’s angular size is a measure of how large the object appears to be, which depends on both actual size and the distance to the object. This example is familiar to everyone: an object that is near to you appears larger (that is, it has a larger angular size) than when it is farther away from you.
What is the basis for this full moon illusion? It is not that the moon appears larger on the horizon because it is seen next to things like trees and houses, since airline pilots flying at very high altitudes sometimes experience the moon illusion without any objects in the foreground. One well-supported theory is that your brain “thinks” the region of the sky overhead is closer than the region of the sky at the horizon, so it adjusts the size of the moon’s image accordingly. Think about it: birds, clouds, and airplanes flying overhead seem closer than birds on the horizon do. When the moon is near the horizon, your brain miscalculates the moon’s true distance and size.

One way to explore this phenomenon is with afterimages. An afterimage is the image you see when you look at a brightly colored object and then look away. It is caused by fatigue of your cone cells. There are three types of cone cells, loosely called blue, green and red, depending on which type of light they respond to best. When you look at a red object, for example, the red cone cells are preferentially stimulated. The stimulation of the red cone cells causes them to send a message to the brain, saying, in effect, “the color of the object is red.”
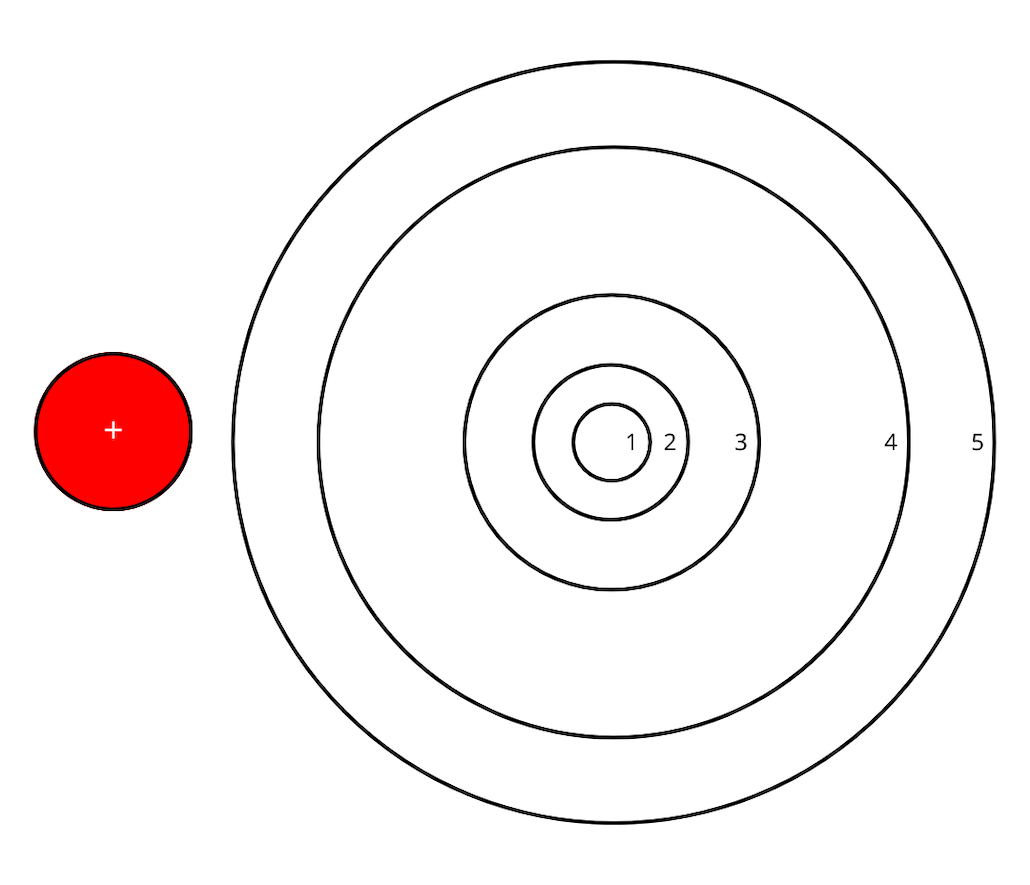
Prolonged exposure to a particular color can cause cone cell fatigue. For example, if you stare at a red object, the red cones become fatigued and temporarily unable to respond. If you look at a white area after staring at a red image, you will see an afterimage that is the same size and shape as the original, but a different color. Try this by looking at the red circle in Figure 2 for 30 seconds, then looking at the white region to the right. Can you see the blue-green afterimage?
Why is the afterimage blue-green? When you look at the white surface after staring at the red object, your eyes will essentially receive equal doses of red, green and blue light. But only the blue and the green cones are able to respond. Because of cone cell fatigue, the input from the red cones is missing from the region of the afterimage. So you see the afterimage as blue-green.
The afterimage disappears over time because the red cone cells recover from their fatigue and become active again. When the red cone cells are active again, all three types of cone cells respond to the white surface, and you see the white region normally.
How can we use afterimages to explore the full moon illusion? The actual size of the image on your retina, caused by staring at the colored circle in Figure 2, does not change. But, as you will see in this experiment, the perceived size of the afterimage depends on the distance between you and the surface on which you view the afterimage. In other words, the perceived size of the afterimage varies directly with the distance of the surface on which it is viewed. This relation is an instance of a more general perceptual relation, known as Emmert’s law, which states: The perceived size of a particular visual angle is directly proportional to its perceived distance.
You will use Emmert’s law to study the full moon illusion. How much bigger does the moon appear to be at the horizon? In other words, what is the magnitude of the moon illusion? In this human biology science fair project, you will estimate the size of the brain’s miscalculation in the full moon illusion.
Terms and concepts
- Horizon
- Angular size
- Full moon illusion
- Afterimage
- Cone cell
- Cone cell fatigue
- Emmert’s law
- Zenith
Questions
- How is an afterimage formed?
- Restate Emmert’s law in your own words.
- Does the full moon illusion also occur with other celestial objects, such as constellations?
Materials and equipment
- Tape measure (metric)
- Lab notebook
- Computer with Figure 2 pulled up on your monitor or printed out (in color)
- Helper
- String (9 meters, or 30 feet)
- Timer or clock that shows seconds
- Graph paper or a graphing computer program
- Area with a clear view of the horizon and the zenith (the region of the sky directly overhead)
- Yellow and blue construction paper (one sheet each). Although it is less preferable, a blue pen or pencil and a white sheet of paper may be used instead.
- Scissors
- Ruler
- Glue
- Plain white paper or colored paper (one sheet)
- Lab notebook
Experimental procedure
Part 1: Evaluating afterimage size in relation to distance of the viewing surface
1. Look at the right side of Figure 2. Measure the diameters of the five circles on your computer screen with the tape measure and record the measurements in a data table in your lab notebook.
2. Turn off any lights and close any window blinds near your computer. Sit in a normal position in front of the image and use your piece of string to measure the distance from your eyes to the computer screen. Keep your head in the same place and have your helper measure that length of string with a tape measure. Have the helper also record the measurement in the data table in your lab notebook. Use the string because it is safer than using the tape measure near your face.
3. Look again at Figure 2. Stare at the red circle for 30 seconds and then look at the white region to the right with the circular lines. Do not change the distance from your head to the image when you switch from looking at the red circle to the white region.

4. Which circle does the afterimage fit in? The goal is to find which circle best represents the size of the afterimage. Have your helper record this information in your lab notebook.
5. Move your head farther away from, or closer to, the screen. You should see a dramatic change in the size of the afterimage.
6. Keep moving your head until the afterimage just fills in circle 1. Stop and have your helper measure how far your eyes are from the image now, again using the string and measuring the string with the tape measure. Record this number in your lab notebook.
- Tip: The afterimage will only last a few seconds as your cone cells recover. If it disappears before you can adjust the afterimage to fit in circle 1, repeat steps 3 and 6. Be sure to start with your head the same distance from the image as it was in step 2.
7. Repeat steps 3 and 6 for each of the other four circles, always starting with your head the same distance from the image as it was for step 2. As you move farther away from the image, you will need your helper to continue measuring the distance you are from the image when the afterimages fill in each circle. Record all measurements in the data table in your lab notebook.
8. Give your eyes a break, then repeat step 7 two more times, and this time also include circle 1. You should have a total of three measurements for each circle.
9. Now it is time to look at a greater distance. Sitting in the same position but looking toward another wall, have your helper measure the distance from your eyes to a white wall across the room — no more than 9 meters (30 feet) away, but much farther away than the image is. Use the string first, then your helper can measure the string with the tape measure.
10. Look at the red circle for 30 seconds, and then look at the white wall across the room. Quickly guide your helper to use the string to measure the diameter of the afterimage you see on the wall. Then have them use the tape measure to determine the afterimage diameter. Record the data in another data table in your lab notebook.
11. Repeat steps 9–10 two more times.
12. Graph the data: apparent diameter of afterimage vs. distance to screen or wall.
13. What is the relationship between the apparent size of the afterimage and the distance to the monitor or wall? For example, what happens to the apparent size of the afterimage if you double the distance to the background?
Part 2: Evaluating afterimage size in relation to perceived distance to the horizon and the zenith
In Part 1, you established how the size of the afterimage depends on the perceived distance to the surface upon which it is viewed. You can use this same method to determine how your brain perceives the relative distances of the horizon and the zenith, which is the region of the sky directly overhead. To do this, you will “acquire” an afterimage, then look at the horizon and at the zenith. The perceived change in the size of the afterimage reflects the perceived difference in the distance to the horizon and to the zenith.
This part requires you to find an outside area with a clear view of the horizon and the zenith. Do not try it at noon, when the sun is directly overhead, since this interferes with your observation of the afterimage at the zenith. Mid-morning or evening is probably best. And the day should be fairly cloudless with a lot of blue sky to look at.
1. First you need to create an afterimage that will appear against the blue sky, so you will need a blue-colored object.
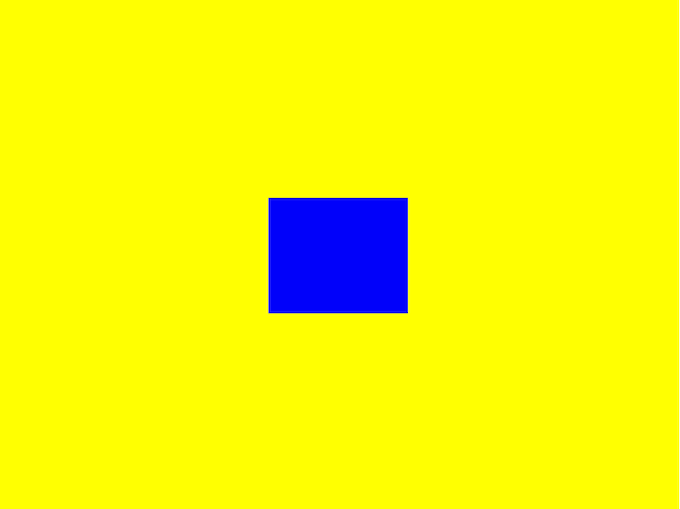
- Cut out a 5-centimeter (2-inch) square from the blue construction paper and glue it to the yellow construction paper, as in Figure 3. The yellow background is helpful because it makes the afterimage more visible against the sky.
- Alternative: Draw a 5-centimeter (2-inch) square using a blue pen or pencil on a yellow (preferred) or white background.

2. Go to the location with the clear horizon and zenith view, on a day when the sky is blue with few clouds. Remember, do not try this at noon because the sun overhead would prevent you from looking at the afterimage at the zenith.
3. Stare at the blue square for 30 seconds and then look at the horizon.
4. Record in a data table in your lab notebook if there was an apparent change in the size of the afterimage. You might use terms as simple as smaller, larger or the same size in relation to the blue square.
5. Repeat steps 3–4 two more times, recording your information in your lab notebook each time.
6. Now stare at the blue square for 30 seconds and then look at the zenith.
7. Record in a data table in your lab notebook if there was an apparent change in the size of the afterimage. You might use terms as simple as smaller, larger or the same size in relation to the blue square.
8. Repeat steps 6–7 two more times, recording your information in your lab notebook each time.
9. Overall, did the afterimage appear smaller, larger or the same size at the horizon compared to at the zenith?
Part 3: Estimating size of the afterimages perceived at the horizon and at the zenith
In Part 3, you will use different-sized squares to estimate the relative size of the afterimages perceived at the horizon and at the zenith. The idea is to learn what different relative sizes look like and then apply that learning to estimating the relative sizes of the horizon and zenith afterimages. The image (and the sun) looks bigger on the horizon than it does at the zenith, but by how much? So if we say it is size “1” at the zenith, what is it at the horizon? Is it 1.5 times as large? Two times as large? The goal is to assign an approximate numerical value to the size of the full moon illusion.
1. Draw squares of increasing size on a sheet of paper (the color of the paper does not matter for this step). For example, the sides could be 2.5, 3.75 and 5 centimeters (1, 1.5 and 2 inches). Cut them out and compare each square to the square with 3.75-centimeter (1.5-inch) sides. Train yourself so that you can easily identify the different relative sizes.
2. Repeat Part 2, but this time estimate the relative size of the afterimages at the horizon and at the zenith by using the three squares you just made.
- You could try doing this by holding up the different sized squares at arm’s length and finding the square that is closest in size to the afterimage, or which sized squares the afterimage is in between in size.
3. Perform additional trials until you are able to settle on a stable number for the change in relative size of the afterimage between the horizon and zenith.
4. Based on your experiments, what is the magnitude of the change of the moon’s apparent size, between the horizon and the zenith, caused by the full moon illusion?
Variations
- Draw more squares of increasing size on pieces of paper and repeat Part 3 in the Procedure using these. Cut them out and compare each square to the square with 3.75-centimeter (1.5-inch) sides. Train yourself so that you can identify the different relative sizes. An exercise might be to flip them all over so that their magnitudes are hidden, mix them up and then try to select the various sizes.
- Repeat Part 2, but this time, include the region of the sky at approximately 45 degrees above the horizon; that is, halfway between the horizon and the zenith. Estimate the relative size of the afterimage at 45 degrees above the horizon compared to the image at the horizon.
- Look at the same angle above the horizon during your trials. You can use a flagpole or a telephone wire, for example, to help you return to the same region of the sky each time.
- Draw a picture of the perceived dome of the sky. What are the relative distances to the horizon and the zenith in the perceived sky dome? How does it compare to a hemispherical dome?
- Demonstrate that the actual size of the full moon does not change as it rises, by taking pictures of it at different angles above the horizon and measuring the diameter of the moon in the pictures.
- It has been reported that the full moon illusion is reduced when the full moon at the horizon is observed through the viewer’s legs. In other words, when looked at upside-down! Does viewing the afterimages through your legs change your results?
This activity is brought to you in partnership with Science Buddies. Find the original activity on the Science Buddies website.


