Musicians could benefit from teens’ research that pictures sound
The new research could help violin shoppers and vocal coaches, among others

By recording musical notes and turning them into pictures, two teens came up with techniques that could help violin shoppers and vocal coaches, among others.
iunewind/ iStock /Getty Images Plus
By Sid Perkins
Washington, D.C. — The human ear is an amazing sensor. It can detect a wide range of sounds. But it often can’t discern subtle differences between similar tones. Nor can the human brain “record” sounds for playback and analysis. Such abilities could help shoppers looking for a good musical instrument. They also could aid vocal coaches. Now, two teens are turning to technology to tackle such acoustic challenges.
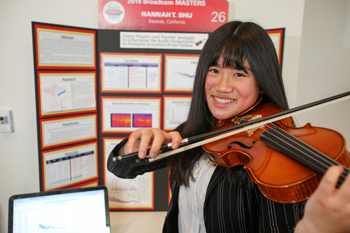
Isabelle Katz, 15, lives in Moraga, Calif. Hannah Shu, 14, resides in Seaside, Calif. Each had a science-fair project last year that performed detailed mathematical analyses of musical tones, among other things. These projects qualified each teen to become a finalist, late last month, in the ninth annual Broadcom MASTERS competition.
MASTERS stands for Math, Applied Science, Technology and Engineering for Rising Stars. Open to U.S. middle-school researchers, this program was created by Society for Science & the Public. (The Society also publishes Science News for Students.) Broadcom Foundation, headquartered in Irvine, Calif., sponsors the event.
Both Isabelle’s and Hannah’s projects were impressive. After all, each allowed the girls to make it through a screening process that knocked out at least 2,200 other applicants.
A sound analysis

Hannah has played the violin since she was eight. For her project, she asked a simple question: Does a high-cost violin produce better music then an inexpensive one? To answer that, she turned to math. She used it to compare the tones produced by different instruments.
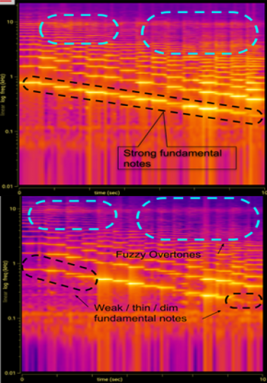
The teen recorded the same notes on her smartphone as she played them on different violins. Computer software then converted those recorded sounds into graphs. (This is the same sort of software that scientists use to analyze the songs of birds and whales, Hannah notes.) In her graphs, powerful pitch frequencies showed up in bright yellow. The software depicted less-powerful ones in a subdued purple. Hannah used these graphs to assess each violin’s overall sound quality.
In theory, a musical note has a single frequency. But in practice, that’s not true, Hannah points out. Stringed instruments, such as violins, produce “notes” that contain a range of frequencies, she explains. The dominant tone should be what’s called its fundamental frequency. That’s the sound a string makes as it vibrates back and forth as a single unit. Higher-frequency components of a string’s movements create what are called overtones. They develop when a string vibrates back and forth in a wave-shaped manner. The larger the number of waves there are between one end of the string and the other, the higher the frequency of that particular overtone.

In general, a musical tone is pleasing if the fundamental frequency is louder than its overtones. But poor-quality instruments don’t always produce such tones, says Hannah. The fundamental may be only slightly louder than its overtone. And in some, the overtones can dominate.
On average, each of the eight most expensive violins that Hannah tested cost more than $8,000. The cheapest 16 averaged just a bit more than $1,250 each. Maybe it’s no surprise, but the costliest instruments tended to produce better tones, Hannah found. Yet some low-cost instruments sounded nearly as good as the pricey violins.
She now suggests that the type of analyses she did might help violin shopper identify a bargain — or avoid a dud.
Sonic bull’s-eye
When expert musicians refer to musical tones, they often use words like “fat,” “bright” or “mellow.” A bit vague, these terms could mean different things to different people, says Isabelle. Non-experts, especially, might become confused. So Isabelle decided to describe and clearly depict musical tones mathematically. That should provide data that would be equally useful to all.
As Hannah did, Isabelle recorded and analyzed the musical tones produced by stringed instruments. But unlike Hannah, Isabelle used pianos — three brands of them.
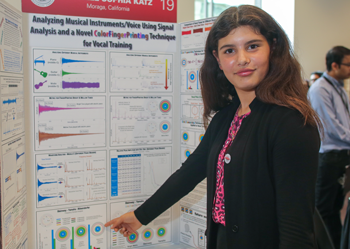
She started by analyzing 10 different recordings of the so-called middle C note from each instrument. It has a fundamental frequency of about 261 hertz. (One hertz is the same as 1 cycle, or vibration, per second.) For each brand, she calculated the average intensity, or volume, of the middle C’s fundamental tone. She did the same for each of that note’s first six overtones. Then, she graphed the seven frequencies for each brand of piano.

To make these graphs easier to compare, she adjusted each so that the loudest fundamental or overtone had a value of 1.
Each brand of piano, she showed, had a different balance of frequencies. Isabelle decided to depict her frequency maps using rings of different colors. The resulting maps looked a bit like an archer’s target. The blue center of the bull’s-eye represented the fundamental frequency. Just outside was a green ring. It depicted the first overtone. Outside of that ring were rings of (in order) yellow, orange, purple, black and dark green. The width of each ring related to the volume of that overtone.
Such maps offer a type of “fingerprint” of the note for that instrument. These could be used to tell one brand of piano from another. And with just a little practice, Isabelle says, someone could learn to read such a graph and interpret a note’s balance of frequencies.
Her colorful bull’s-eyes could find many uses. For instance, they could be one way to monitor a piano’s tones over time. Indeed, big changes in a note’s fingerprint might signal it’s time to tune the instrument.
Vocal coaches might find these maps useful, too. They could record a student’s voice and then display its mix of frequencies. The coach could then compare that fingerprint to an ideal mix of frequencies for that note as sung by experts. Over time, a coach — or student — could monitor how a fingerprint changed and potentially improved.
Isabelle hopes to one day develop a phone-based app based on her technique. She also wants to file a patent on it, form a company and (maybe most of all) find investors who can help her develop her ideas further. For now, once she’s developed her app she’ll test it out on members of the choir in which she sings.
A sound reward
STEM stands for Science, Technology, Engineering and Mathematics. For her qualifying project, Isabelle nabbed the $3,500 first-place award in the Mathematics category at Broadcom MASTERS.
In most student science competitions, the majority of the finalists’ scores is based on their qualifying science-fair projects. That’s different from how it works at Broadcom MASTERS. Here, roughly four-fifths of the finalists’ scores are based on the creativity and teamwork they show in helping to solve on-the-spot research challenges.
Note: This story was corrected to show that Isabelle took first place in the mathematics category at this competition.


