Predicting a wildfire with data from space
Teen finds out if satellite data could be used to predict when fires could flare

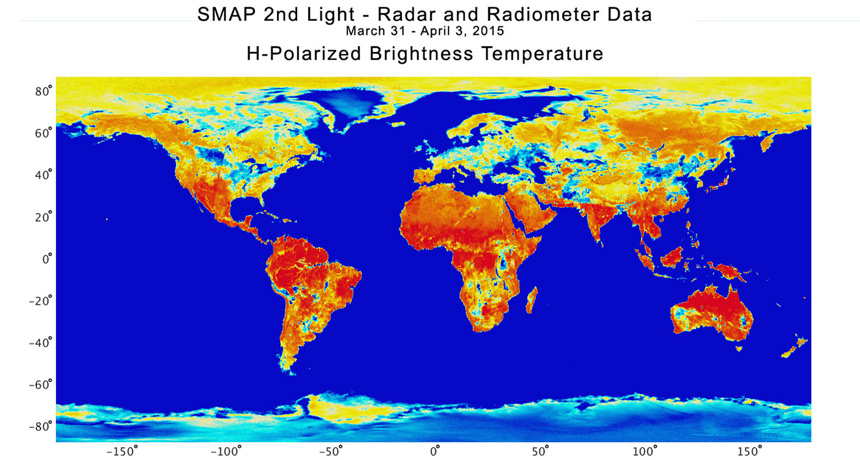
Map from SMAP satellite data in 2015. Redder hues point to low soil moisture or high levels of plant cover. Blue highlights high soil moisture or water. Yellow at top and bottom of the map point to frozen ground and ice.
NASA/JPL-Caltech/GFSC
WASHINGTON, D.C. — On average, wildfires destroy more than 2.4 million hectares (6 million acres) of land each year in the United States. Last year, the U.S. Forest Service spent more than $1 billion fighting those fires, mostly out West. Blazes start easily where there is plenty of dry fuel, such as dead grass, sticks and other dried plants. Knowing how much fuel is available can help fire management teams know where and when to be on high alert. And a Boston, Mass., teen has figured out a way to home in on such areas quickly. To do it, she turned her eyes to the skies.
Nadine Han, 13, is a seventh grader at Boston Latin School. Wildfires aren’t very common in New England, so you might not think a teen would have a lot of interest in them. But when Nadine built a robot three years ago with FIRST LEGO League, hers was designed to prevent wildfires. When the girl’s family visited Yellowstone National Park, later that year, what did they see? Evidence of wildfires. So Nadine followed up on that theme for her science fair project. She decided to find out whether satellite data might be used to predict when and where wildfires might ignite.
Her findings worked well to predict soil moisture — a gauge of how much dry fuel a region had. And they qualified her for a trip to Washington to compete in Broadcom MASTERS. MASTERS stands for Math, Applied Science, Technology and Engineering for Rising Stars. Every year, this event brings together 30 middle-school students from around the United States to show off their award-winning science fair projects and to compete in team challenges. The event was created and is run by Society for Science & the Public (which also publishes Science News for Students and this blog). Broadcom Foundation sponsors the competition.
Finding out where fires might flame
To determine whether an area has a lot of fuel around, specialists collect samples of plants in an area and calculate their fuel moisture. They’re probing how much water is present in plant tissue and debris, compared to the plants’ dry mass.
“Measuring fuel moisture is really labor intensive” — and therefore expensive, Nadine points out. So calculations of fire risk for any given area are not usually done very frequently, she notes. Nadine decided to see if there might be some lower-cost measure that could figure out fire risk for broad swaths of land. And what scans the entire nation frequently? Satellites!
The teen learned about a satellite called SMAP, which stands for Soil Moisture Active Passive. Launched by the National Aeronautics and Space Administration (NASA) in 2015, it detects how wet or dry the soil is. It also can tell whether that moisture is frozen or liquid. SMAP maps Earth’s entire land area every two to three days. Its data not only help scientists to forecast the weather, but also to predict droughts and floods.

SMAP’s data on soil moisture can be combined with other data to determine what’s known as the vegetation water content. This is the amount of water present in the plants. SMAP’s data and the vegetation water content data are both freely available from the National Snow and Ice Data Center. For her project, the teen downloaded a year’s worth of data (for March 31, 2015 to March 31, 2016).
She then compared these data with those for the same time period in the national Wildfire Assessment System. Its data, prepared by Forest Service specialists, estimate fuel moisture levels for the entire United States. The teen was looking to see if the two data sets correlated. She was looking for an apparent match between the fuel moisture and SMAP’s estimate of plant moisture levels for the same areas.
Although related, plant water levels and fuel moisture aren’t quite the same thing, Nadine points out. Plant water content, for example, doesn’t take into account dead debris on the forest floor. It also doesn’t quantify how much overall fuel there is in a forest.
In all, Nadine compared plant water content and fuel moisture data for 1,413 different locations. And she found a positive correlation between them. An increase in plant water content measured by the satellite was linked with an increase in fuel moisture as measured on the ground. For her study, 87 percent of the sites showed such a link.
“This… suggests that it’s feasible to use satellite data to estimate fuel moisture on the ground,” Nadine concludes. Fires are a natural part of life in the American West. In fact, they can occur almost anywhere. Several, for instance, are currently being fought in the East’s southern Appalachian Mountains. The teen now hopes her technique will help land managers determine fire risks more quickly.
Next, Nadine hopes to make a computer program that will estimate fire risk using satellite data. And she’s not alone. Other scientists also are trying to use satellite data to predict wildfires, even using SMAP data. When it comes to predicting fires, a few more eyes in the sky couldn’t hurt.
Follow Eureka! Lab on Twitter


